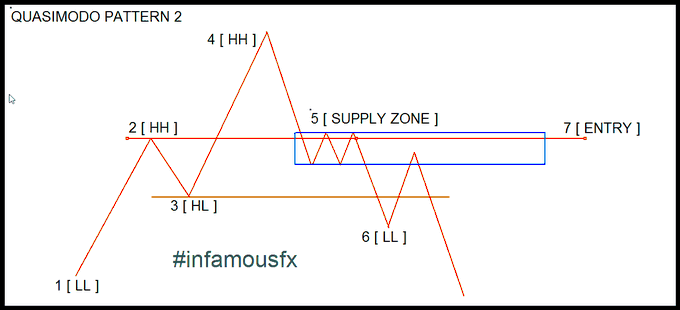
Quasimodo Pattern Explained
The Quasimodo chart pattern is a lesser known bearish chart formation in technical analysis. It has also been called the Over and Under chart pattern. This pattern can identify a high probability confluence area on a chart at a resistance zone that can lead to a reversal in an upswing. It is a signaling pattern […]
Quasimodo Pattern Explained Read More »
