The Anatomy of a Downtrend
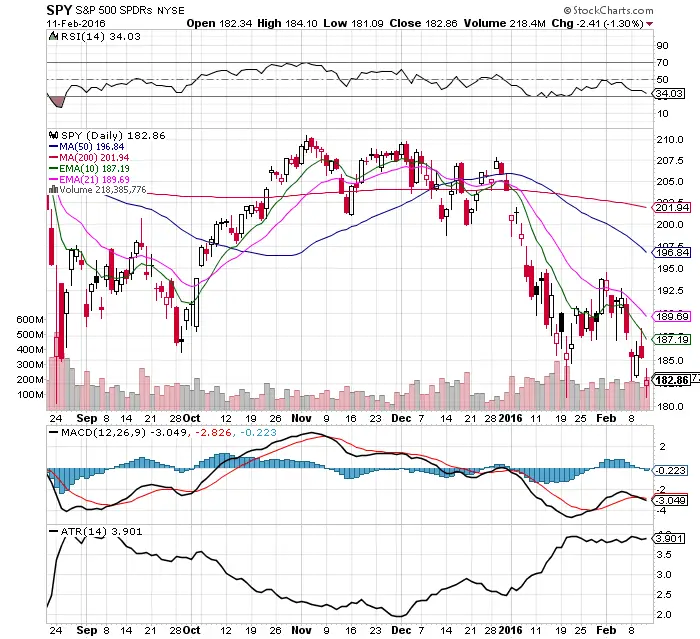
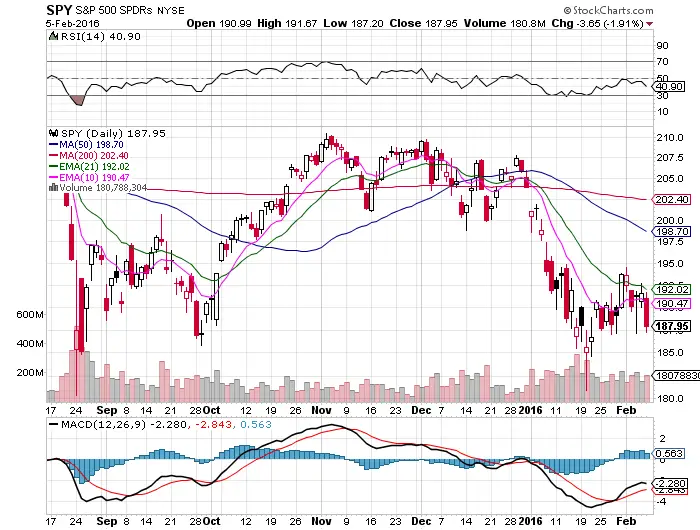
The price drops below the 200 day simple moving average. This is your first warning on the long side to exit and wait for the 200 day to be retaken. The MACD has a bearish crossover. This shows that the uptrend has lost momentum. This is a warning sign that the market could fall as price […]
The Anatomy of a Downtrend Read More »


