Why the Economy is Bullish for Stocks Going into 2019
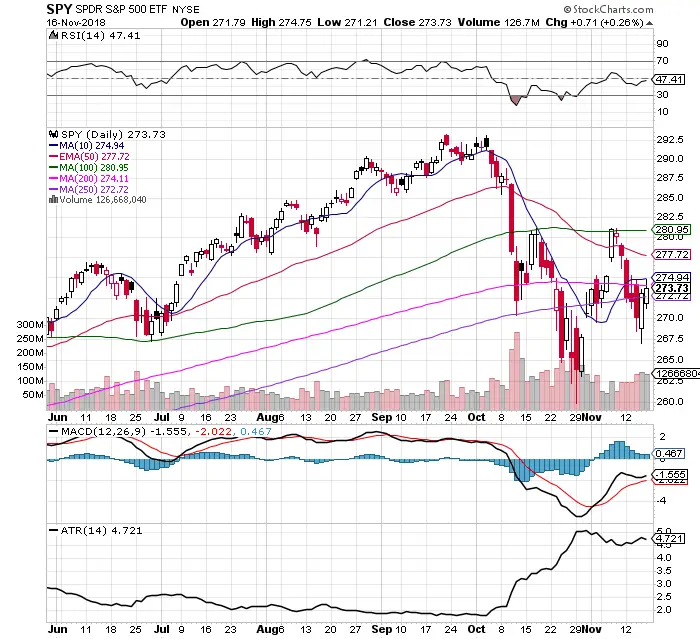
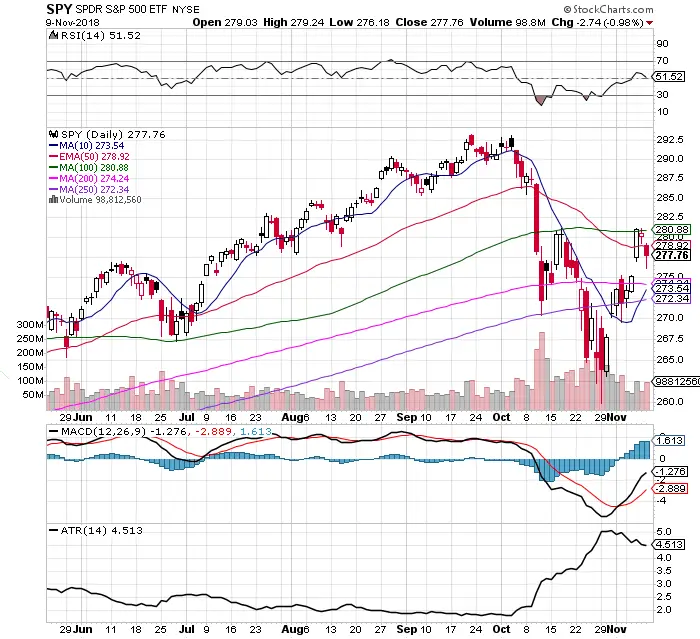
This is a Guest Post by Troy Bombardia of BullMarkets.co Market outlook: why the economy is bullish for stocks going into 2019 As we expected in last week’s market outlook, the U.S. stock market has pulled back after a hard bounce. The S&P 500 has now retraced more than 61.8% of its gains. The economy’s […]
Why the Economy is Bullish for Stocks Going into 2019 Read More »


