The Bear’s Wall of Resistance: $SPY Chart 2/17/19
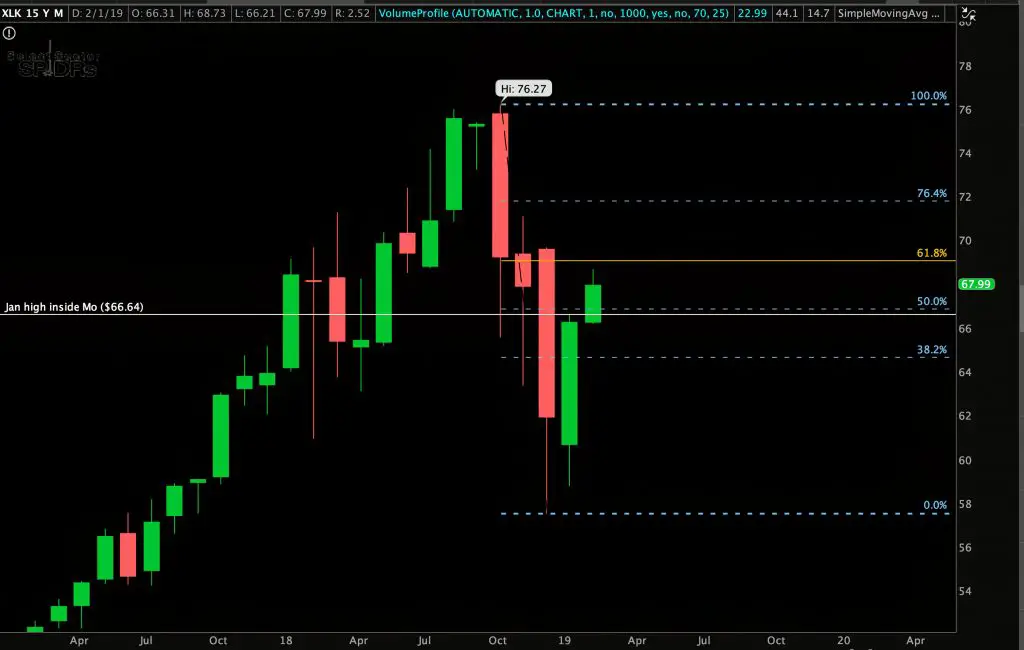
Chart Courtesy of StockCharts.com The RSI is at 69.96, a break and close above the 70 RSI that leads to a new uptrend is a rare event, this is usually the location of at least a short term pullback as the $SPY becomes overbought. The previous price resistance levels were around $280 on the last […]
The Bear’s Wall of Resistance: $SPY Chart 2/17/19 Read More »


