The Support and Resistance Levels on the $SPY Chart: 9/1/19
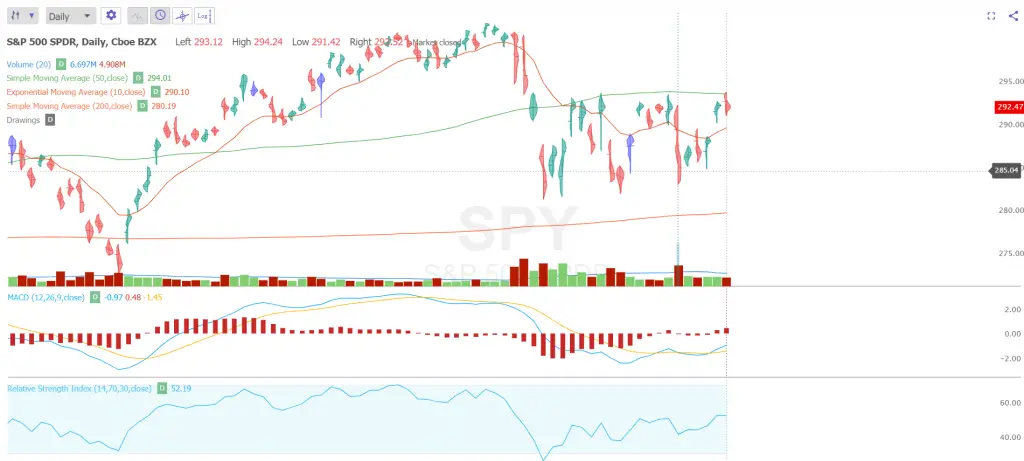
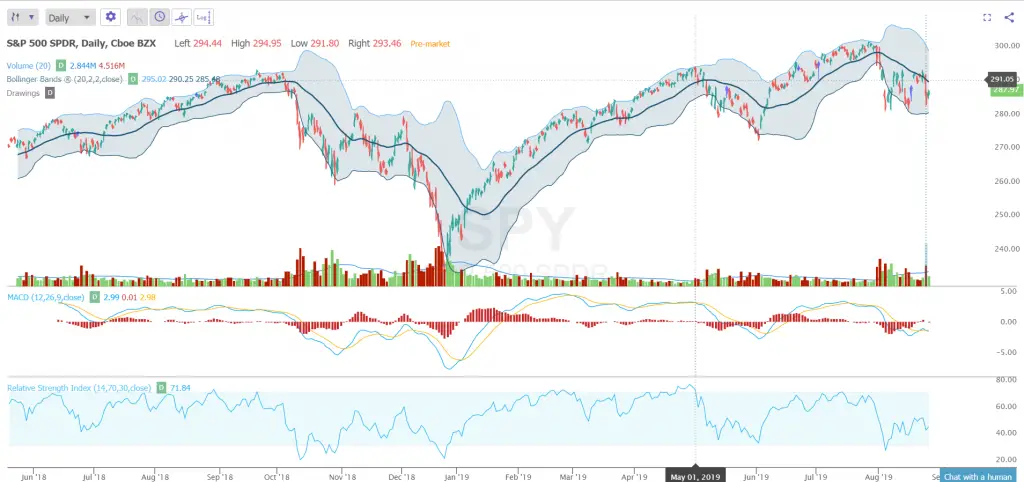
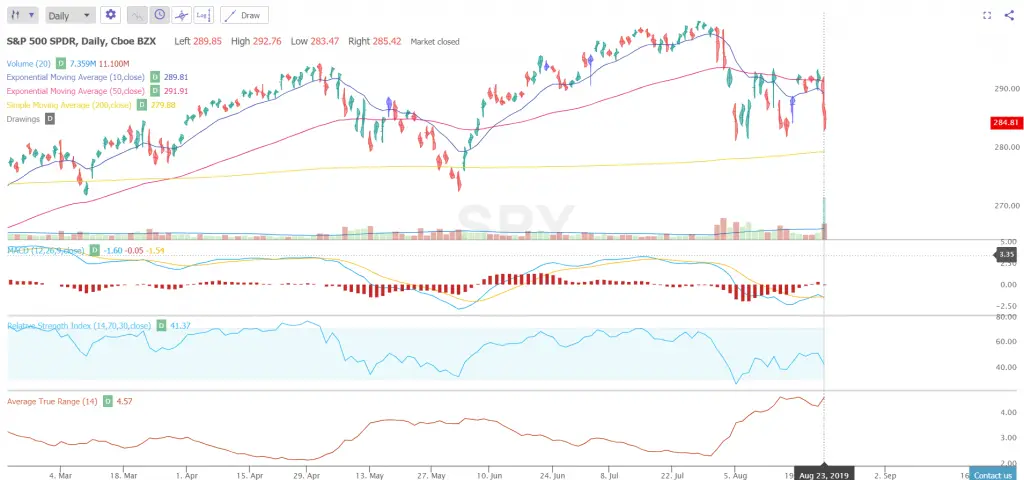
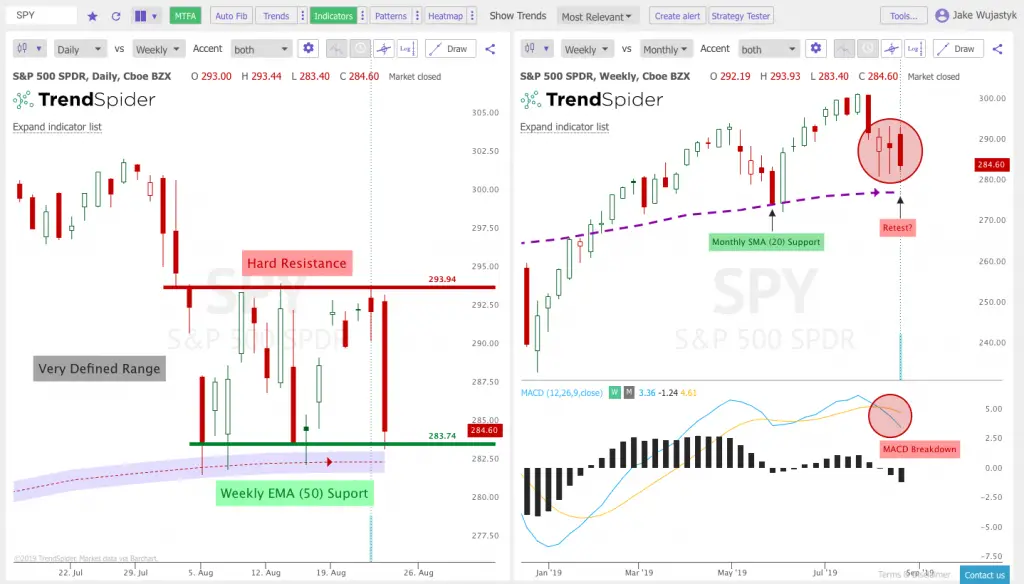
The 50 day moving average is the current resistance on the $SPY chart. The $295 price level has also acted as strong resistance. Current support is the $282.50 price level. RSI is neutral but slightly bullish at 52.19. MACD currently has a bullish crossover. The Average True Range declined late last week to 4.19. The […]
The Support and Resistance Levels on the $SPY Chart: 9/1/19 Read More »
