trend trading strategy

ed seykota trading rules

Ed Seykota Strategy

Ed Seykota is a trend following trader that uses reactive technical analyses through quantified trading signals to capture large profits during trending price action. He has parameters for proper position sizing, volatility filters, and optimizes his strategy for large wins and small losses.  Ed Seykota Trading Rules “In order of importance to me are: 1) […]

Ed Seykota Strategy Read More »

200 Day Moving Average vs Buy and Hold

200 Day Moving Average vs Buy and Hold

Is there a simple moving average trading strategy that crushes buy and hold investing? If so, what moving average and time frame combination would accomplish this going back at least 20 years? The 200-day simple moving average as an end of month signal on the SPY ETF accomplishes this feat.  Buy and hold investing on

200 Day Moving Average vs Buy and Hold Read More »

post earnings announcement drift

What is Post Earnings Announcement Drift?

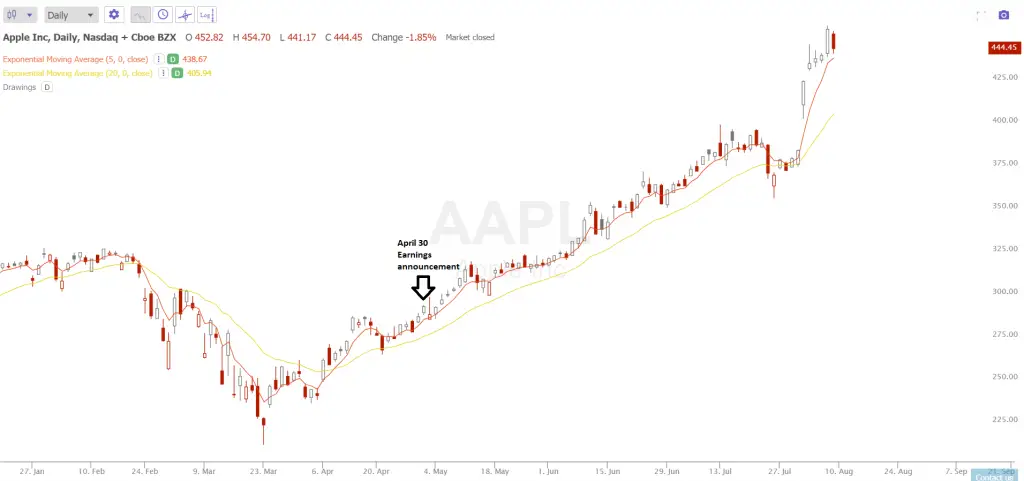
In trading and investing post earnings announcement drift (or PEAD) is the theory that a stock’s price action tends to trend in the same direction as an earnings surprise causes it to go. This effect usually starts with a gap in the direction that it will go for the next few weeks or even months

What is Post Earnings Announcement Drift? Read More »

exponential moving average

Exponential Moving Average Crossover Backtests On $QQQ

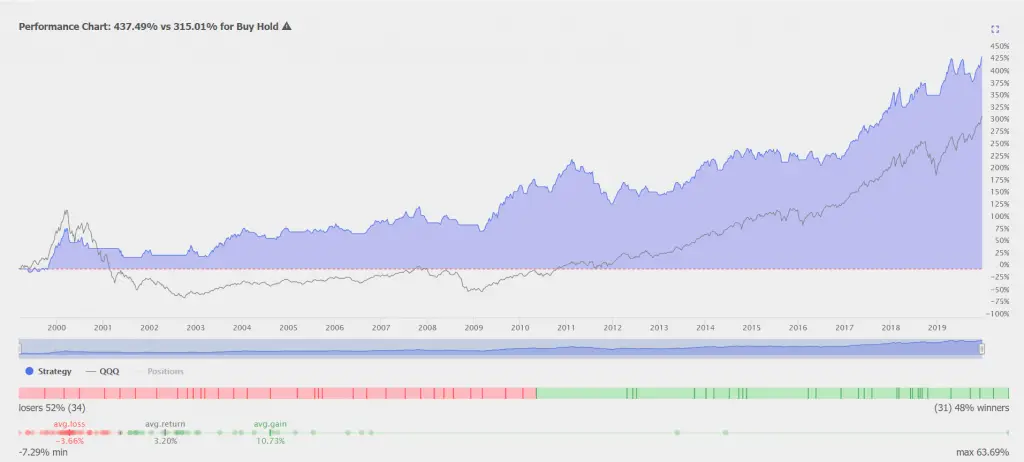
Moving averages are technical trading indicators for capturing trends. This post shows the backtesting data and system equity curve versus buy and hold using TrendSpider.com.  This is the backtest based on buying $QQQ when the 5 day EMA crosses and closes over the 20 day EMA and then selling when the 5 day EMA closes

Exponential Moving Average Crossover Backtests On $QQQ Read More »

trend following indicators

What is the Best Indicator for Trend Direction?

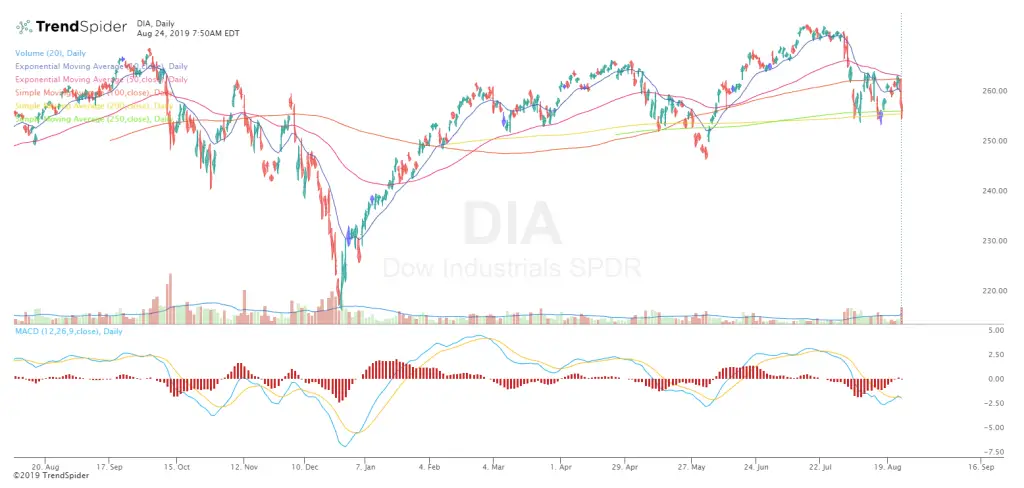
Moving averages are the best indicators for the direction of a trend because of their power and simplicity to smooth out price direction in trend trading. They create lines on your charts to filter out the daily trading ranges and show the true direction a market is going in for a specific time frame. When

What is the Best Indicator for Trend Direction? Read More »

SSO 1

A Simple Trend Trading Strategy

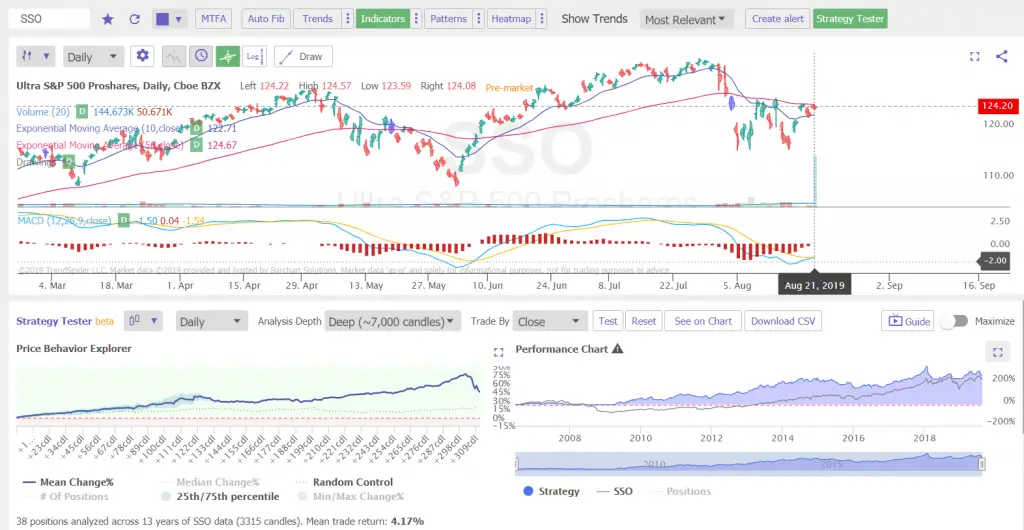
“Trend  followers use reactive technical analysis. Instead of trying to predict a market direction, their strategy is to react to the market’s movements whenever they occur. This enables them to focus on the market’s actual moves and not get emotionally involved with trying to predict direction or duration.” -Michael Covel Trading a trend in price

A Simple Trend Trading Strategy Read More »