Technical Analysis

McClellan Oscillator

What is the McClellan Oscillator?

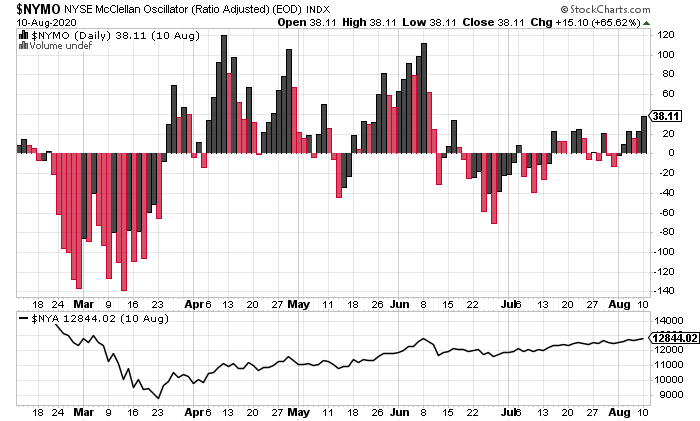
The McClellan oscillator is a market breadth technical indicator used by traders to analyze the New York Stock Exchange listings balance between the advancing and declining stocks over time. The McClellan oscillator quantifies the Advance-Decline Data on a stock market exchange, it could also be used on stock indexes, portfolio holdings, or any watchlist of […]

What is the McClellan Oscillator? Read More »
MACD Technical Indicator

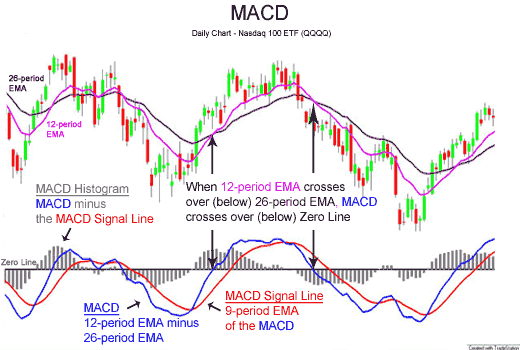
What a MACD Indicator Crossover Signals

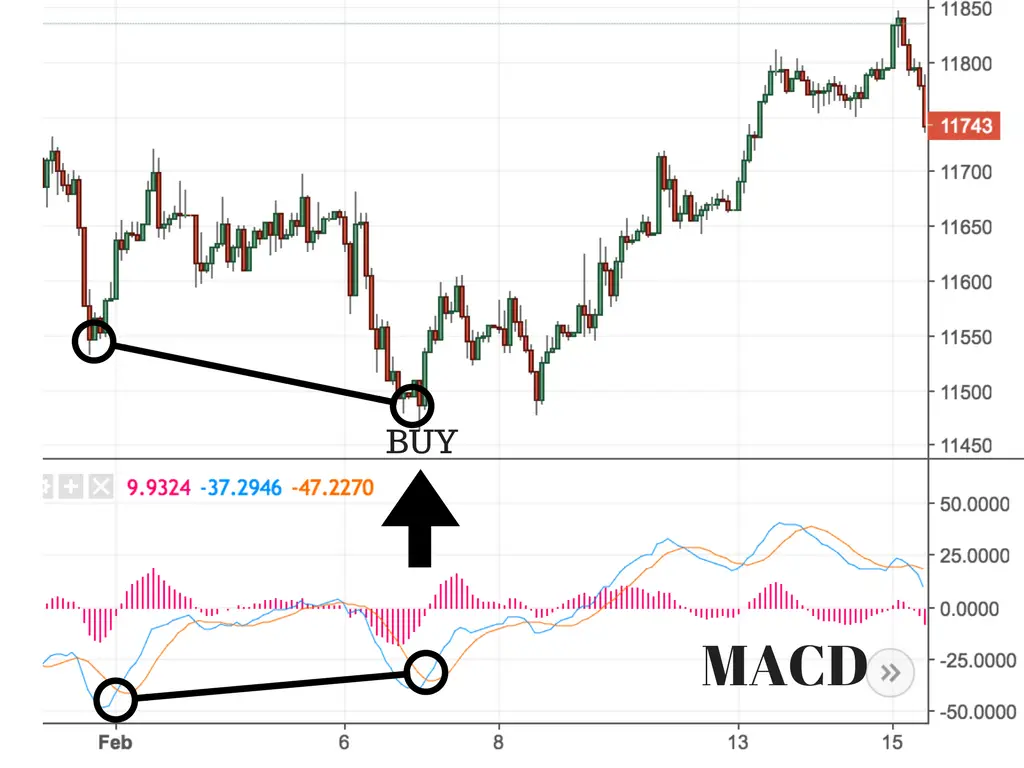
The MACD is an abbreviation for the moving average convergence/divergence technical trading indicator and is used in technical analysis to filter the trends, swings, and momentum of price action. It is designed to reveal changes in price strength, direction, momentum, and duration for the moves of trends and swings. The MACD is a simple visual momentum indicator. The

What a MACD Indicator Crossover Signals Read More »

Moving average

How To Use Moving Averages As Price Action Signals

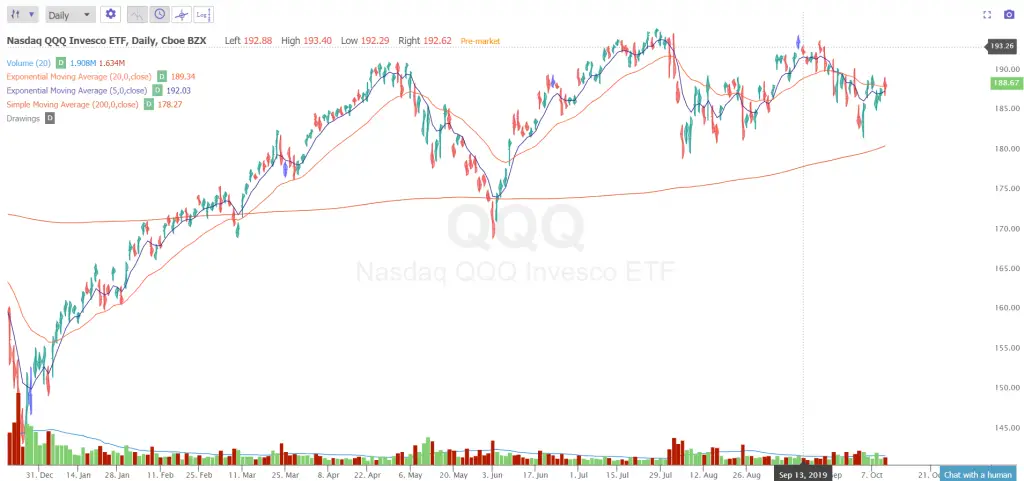
Moving averages are technical trading tools that can help identify trends on different time frames. They can replace opinions and predictions for making trading decisions by being used as signals. Moving averages can identify trends in real time but are not as useful during choppy or range bound markets.  Here are ten ways to use

How To Use Moving Averages As Price Action Signals Read More »