Technical Analysis

Stochastic RSI vs RSI: Is one better than the other?

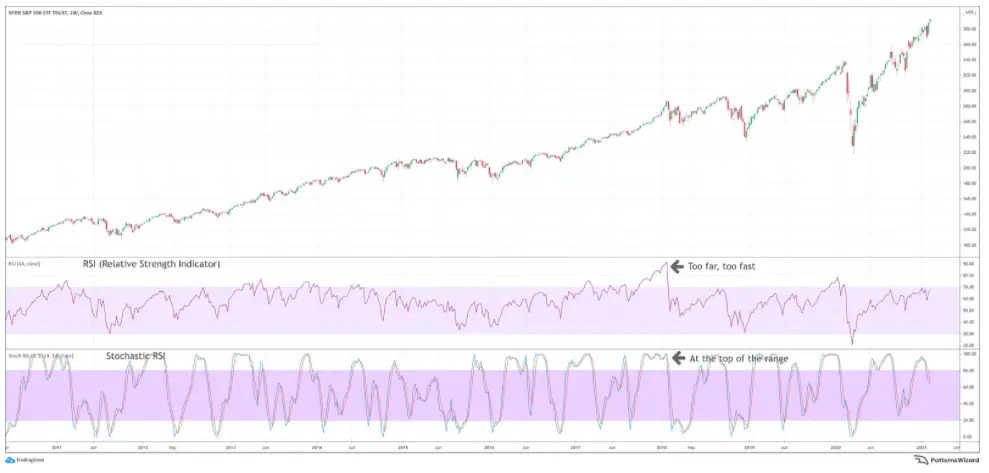
Stochastic RSI vs RSI Indicator: Is one better than the other?

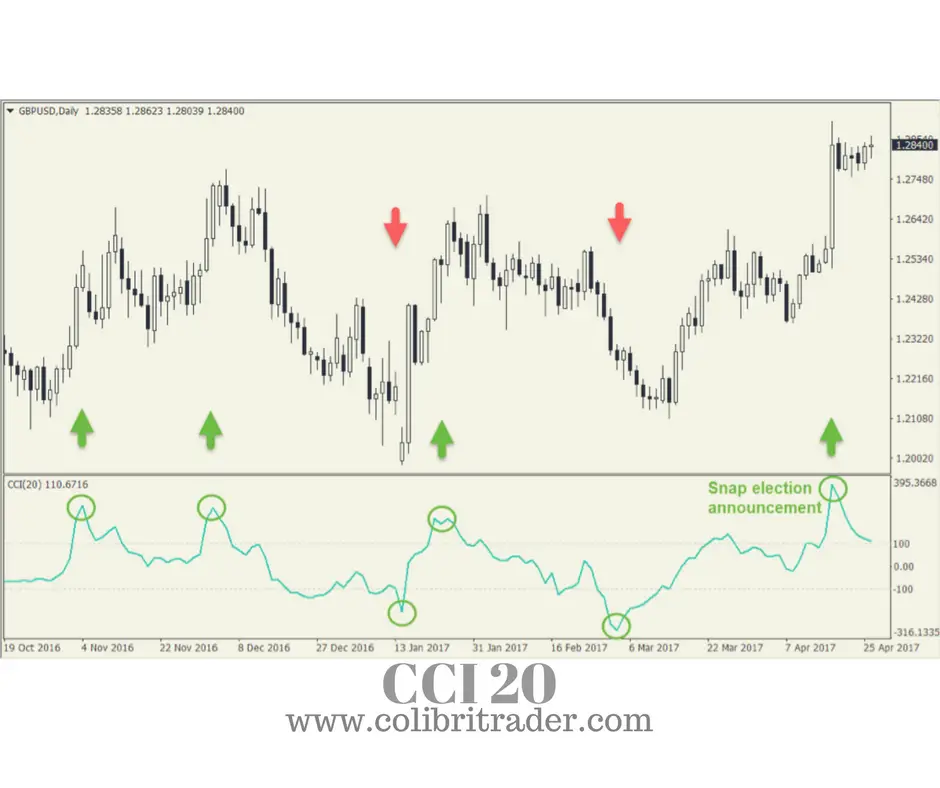
The following is a guest post from @PatternsWizard of PatternsWizard.com What is the Relative Strength Index (RSI)?  RSI is a technical indicator used in technical analysis that helps to gauge the velocity of price changes. It is also a momentum oscillator and can point to overbought/oversold market conditions.  RSI functions on the assumption that prices tend […]

Stochastic RSI vs RSI Indicator: Is one better than the other? Read More »
Is Technical Analysis a Self Fulfilling Prophecy?

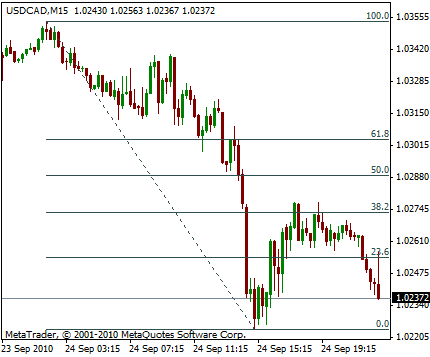
A self-fulfilling prophecy is a process where an original expectation creates the conditions of its own reality. With a self-fulfilling prophecy expectations and behaviors about a future event cause the result that confirm the original prediction. Some speculate that the reason that price support levels and price resistance levels have meaning is because people believe

Is Technical Analysis a Self Fulfilling Prophecy? Read More »

Moving Average Ribbon Signals

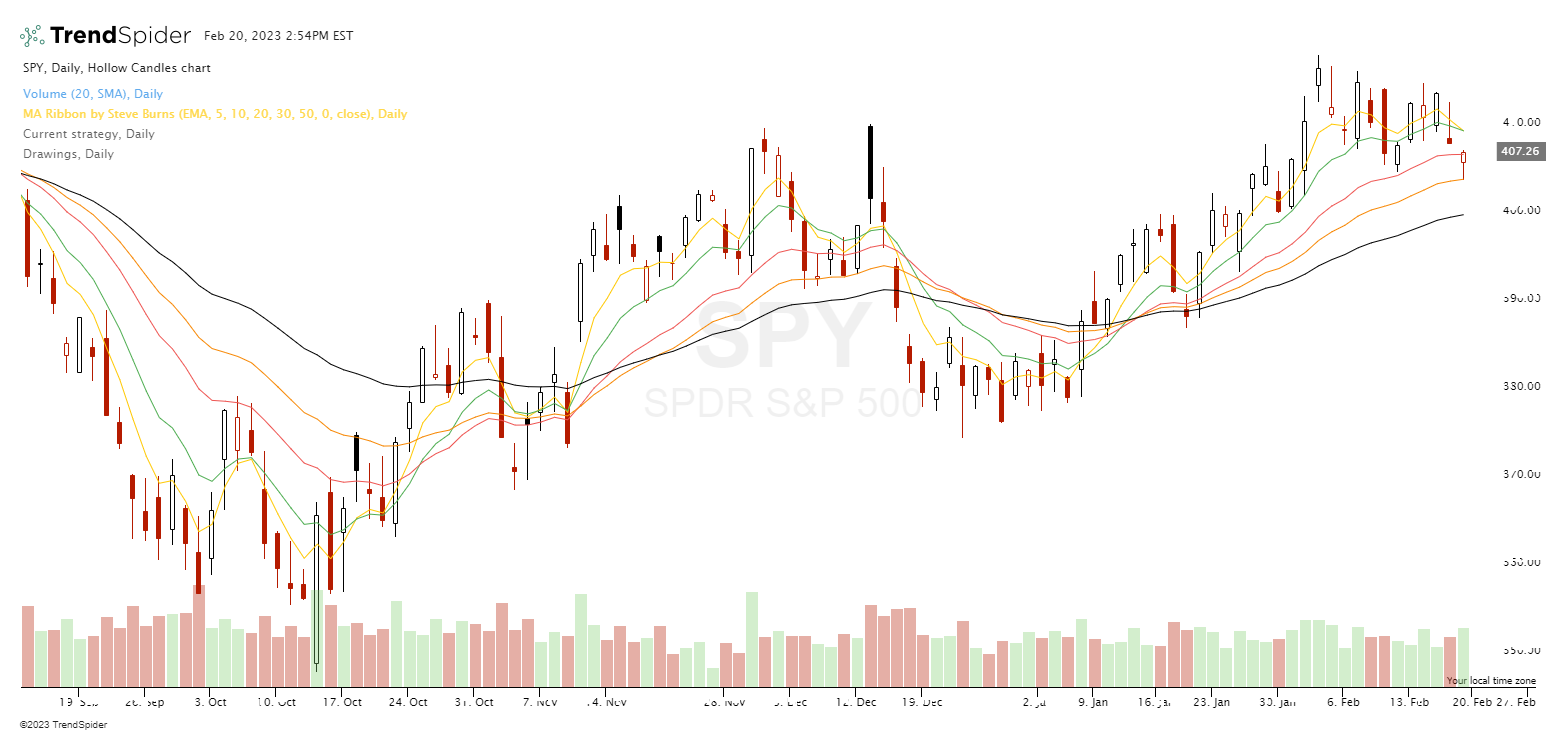
New Technical Indicator: Steve Burns Moving Averages Ribbon

The Steve Burns Ribbon technical indicator is a new tool for the technical analysis of stock trends by combining key moving averages. The MA Ribbon by Steve Burns is currently available on the TrendSpider.com charting platform and can be searched in indicators and loaded onto charts.  The moving averages in the Steve Burns Ribbon can

New Technical Indicator: Steve Burns Moving Averages Ribbon Read More »