Multiple Time frame Analysis

Moving Average Ribbon Signals

Moving Average Ribbon Signals

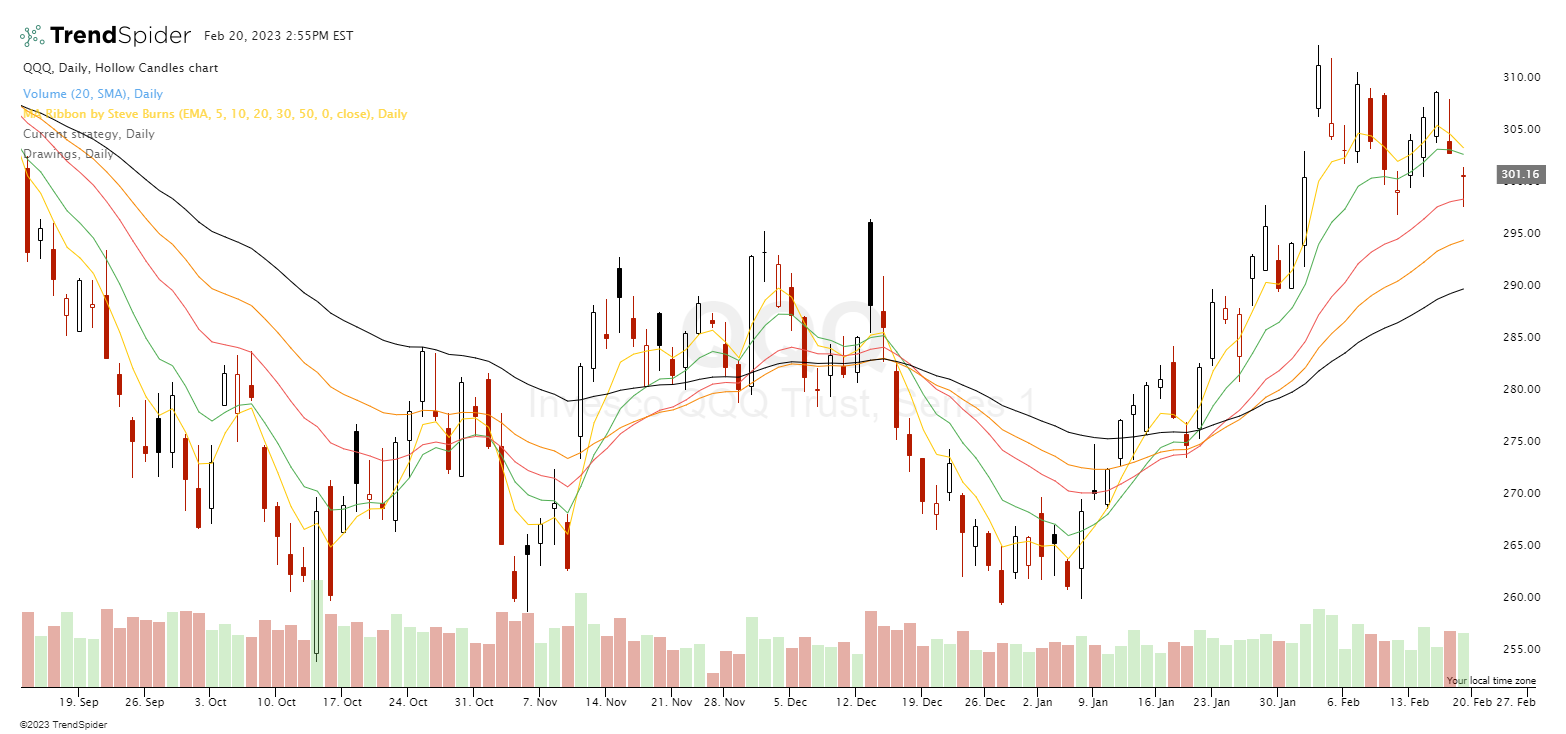
A moving average ribbon indicator is a set of multiple moving averages of different timeframes placed on a chart all at one time. A ribbon instantly shows price action in relation to all the different moving averages.  The Steve Burns Moving Average Ribbon is created with five different length moving averages. Exponential moving averages are […]

Moving Average Ribbon Signals Read More »
TrendSpider

How to Use Multiple Time Frame Analysis on a Chart

This is a Guest Post by Jake Wujastyk of @TrendSpider One of the main things that make TrendSpider unique to other platforms is the ability to overlay charts from other timeframes onto a single chart. In this User Guide post, we take a look at how to use multiple timeframes in your analysis when using the

How to Use Multiple Time Frame Analysis on a Chart Read More »