Moving Average Strategy

200 Day Moving Average Strategy

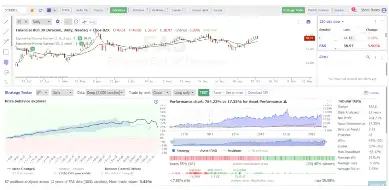
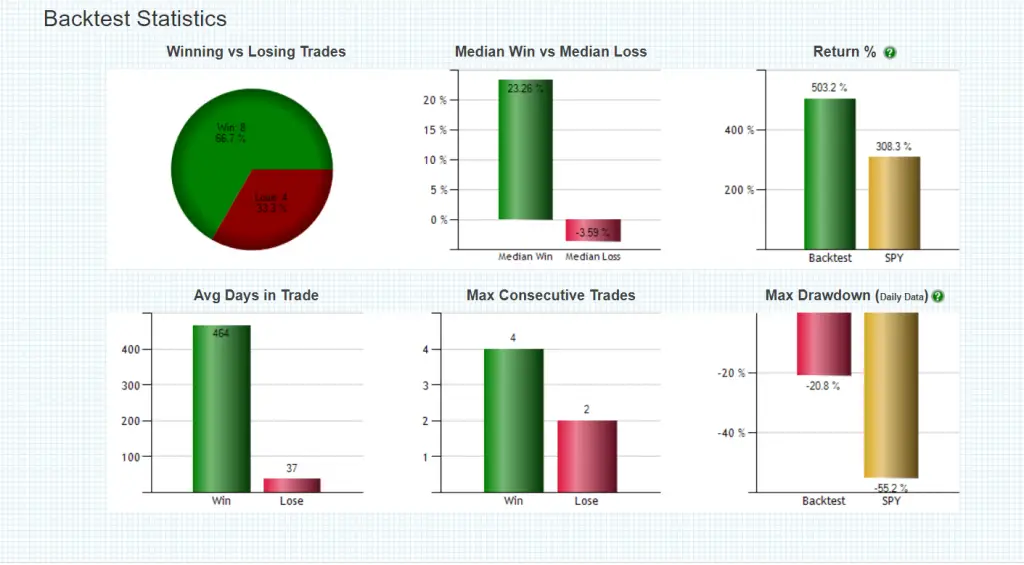
200 Day Moving Average Strategy that Beats Buy and Hold

Buy and hold investing itself is not valid on the majority of individual stocks. Buy and hold works on indexes like the S&P 500 because these indexes are diversified and contain the future biggest winning stocks. Warren Buffett also recommends this strategy as a way to beat the majority of mutual fund managers and hedge […]

200 Day Moving Average Strategy that Beats Buy and Hold Read More »
Moving Average Ribbon Signals

Moving Average Ribbon Signals

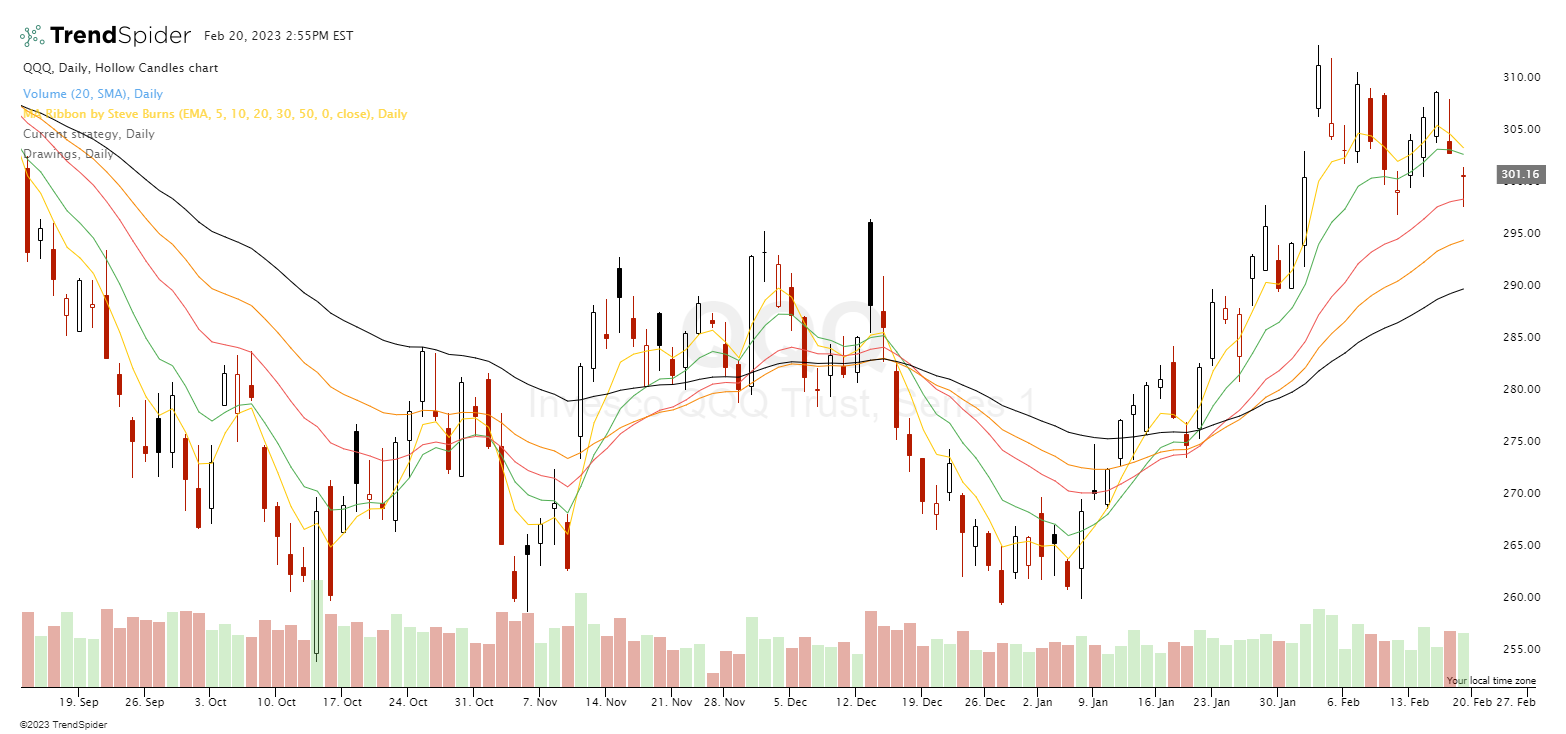
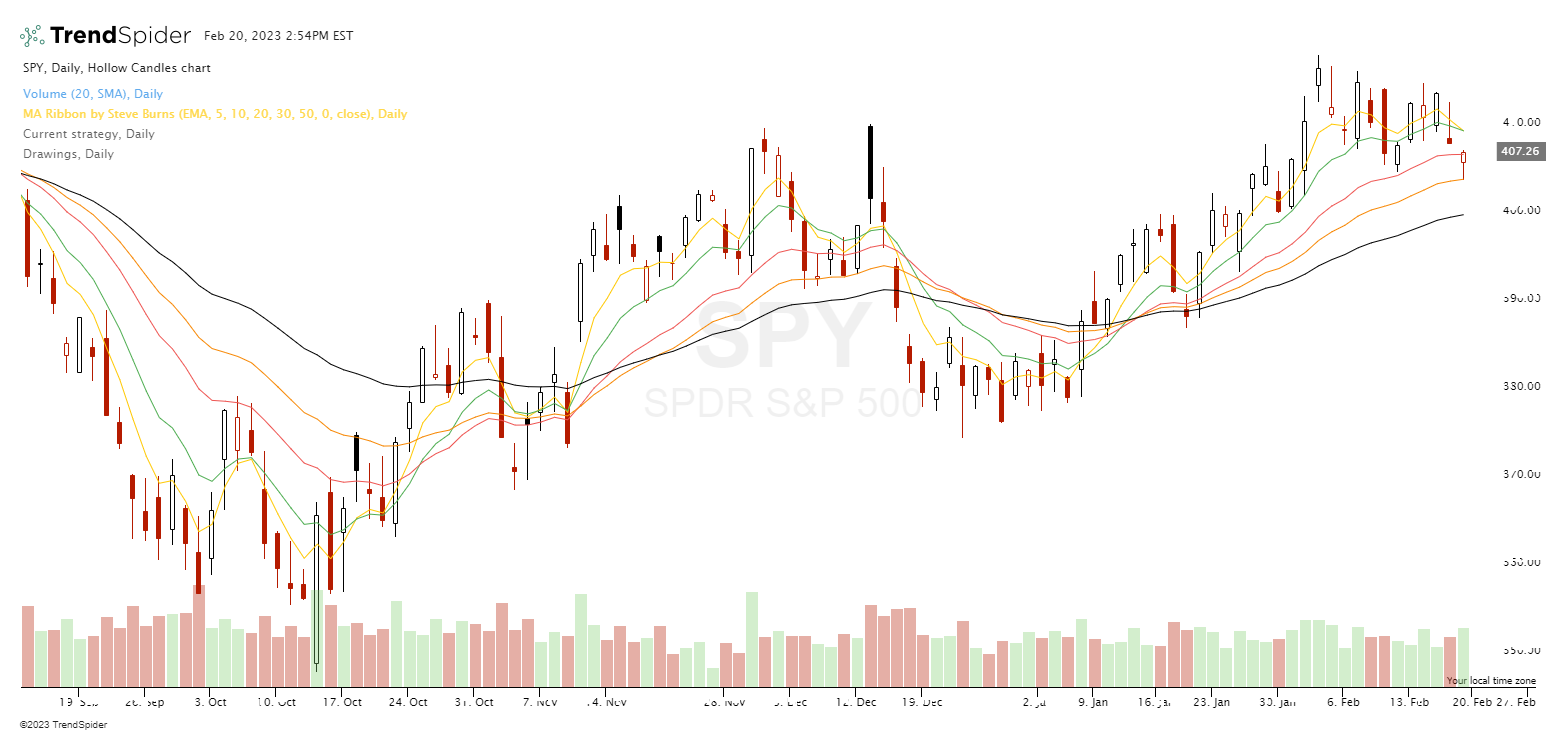
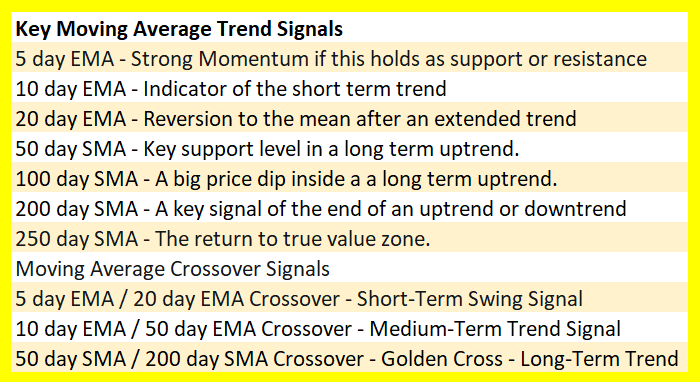
A moving average ribbon indicator is a set of multiple moving averages of different timeframes placed on a chart all at one time. A ribbon instantly shows price action in relation to all the different moving averages.  The Steve Burns Moving Average Ribbon is created with five different length moving averages. Exponential moving averages are

Moving Average Ribbon Signals Read More »

Moving Average Ribbon Signals

New Technical Indicator: Steve Burns Moving Averages Ribbon

The Steve Burns Ribbon technical indicator is a new tool for the technical analysis of stock trends by combining key moving averages. The MA Ribbon by Steve Burns is currently available on the TrendSpider.com charting platform and can be searched in indicators and loaded onto charts.  The moving averages in the Steve Burns Ribbon can

New Technical Indicator: Steve Burns Moving Averages Ribbon Read More »

IMG 7947

Best Exponential Moving Average Crossover Signals

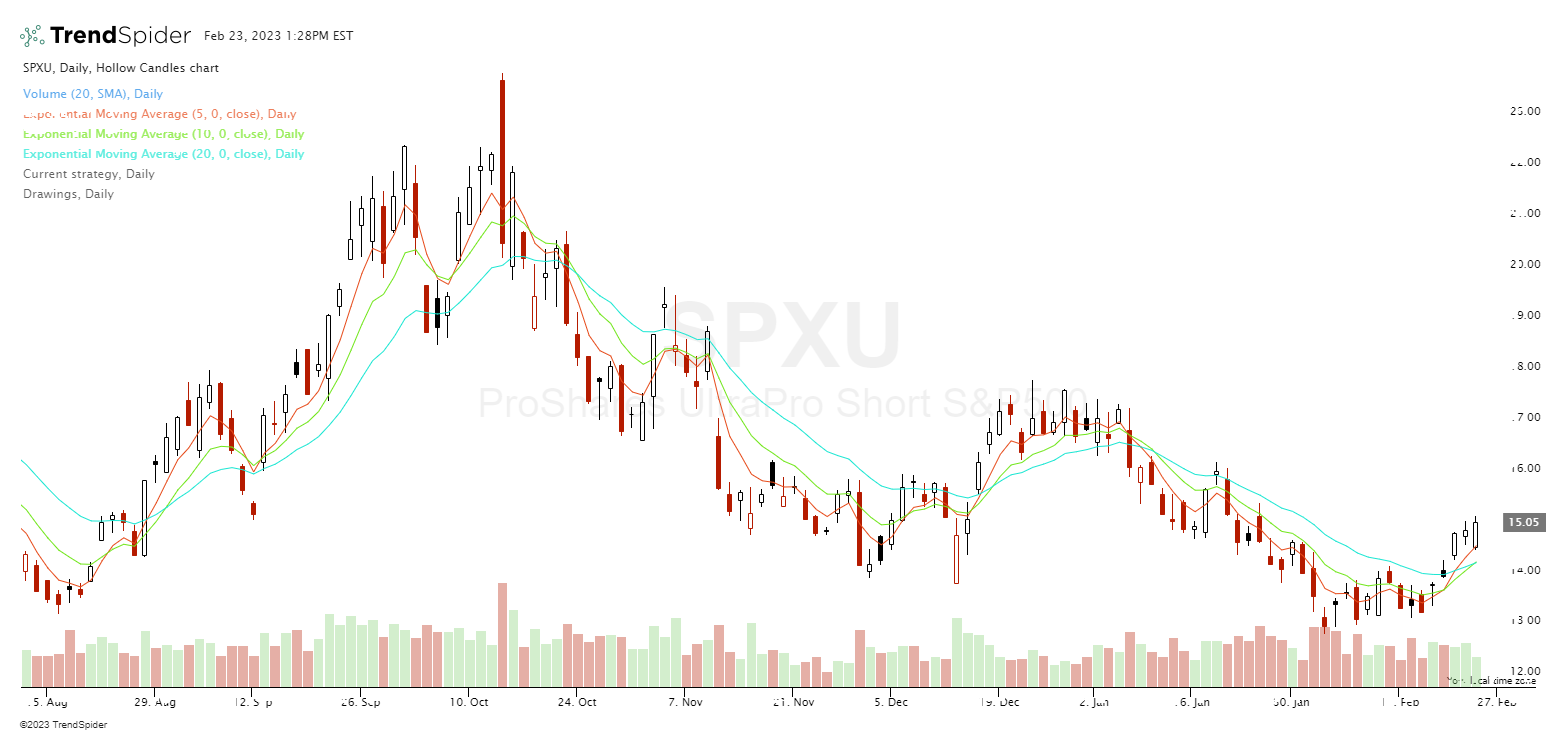
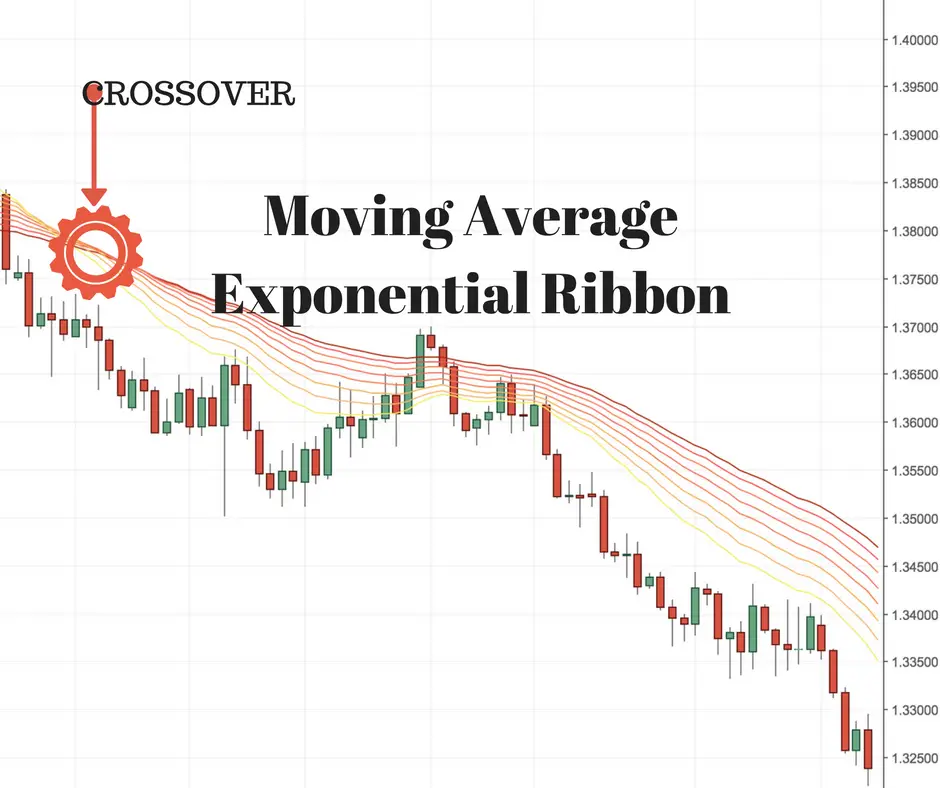
Exponential moving average crossover signals are one way to capture trends on a chart by entering a long trade when a shorter term moving average crosses over a longer term one, then exiting as the shorter term moving average crosses back under the longer term one. The inverse of this are moving average cross under

Best Exponential Moving Average Crossover Signals Read More »

Moving Average Exponential Ribbon

My Favorite Exponential Moving Average Crossover Signal

You have probably heard of the bullish 50/200 day moving average crossover golden cross or the the bearish 50/200 day moving average cross under death cross which is a long term trend signal on charts, especially for the major stock indexes. These signals are even mentioned on financial news networks when they occur in real

My Favorite Exponential Moving Average Crossover Signal Read More »