Chart Reading

The Odds that the Stock Market Will Make a V-shaped Recovery

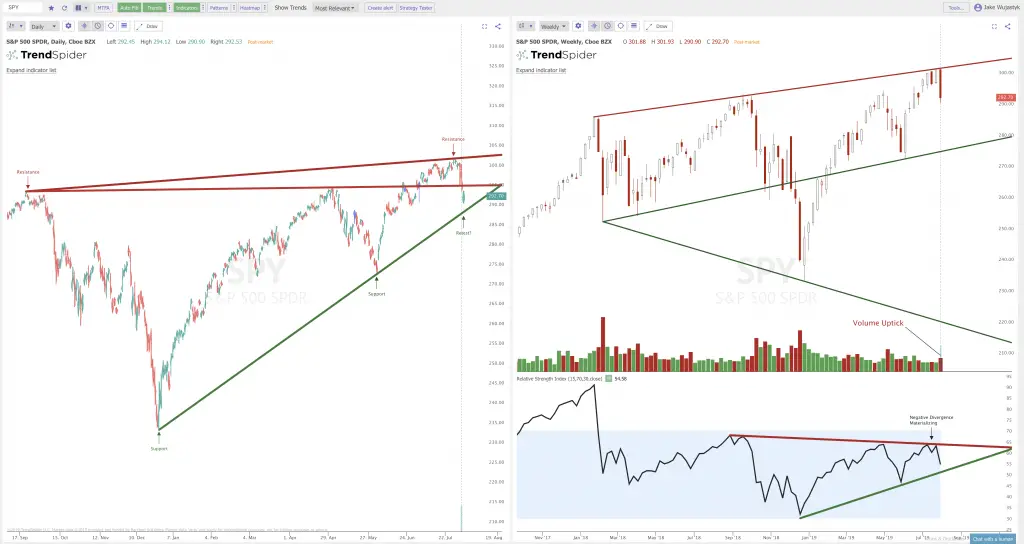
This is a Guest Post by Troy Bombardia of BullMarkets.co. Market outlook: is this a V-shaped recovery? The stock market bounced this week after it tanked last week on trade war news. Is the stock market making a V-shaped recovery? Probably not. Technicals (short term, next 1-3 months): mixed. If I had to assign a probability to a […]

The Odds that the Stock Market Will Make a V-shaped Recovery Read More »
The Probability that the Stock Market Selloff is Over

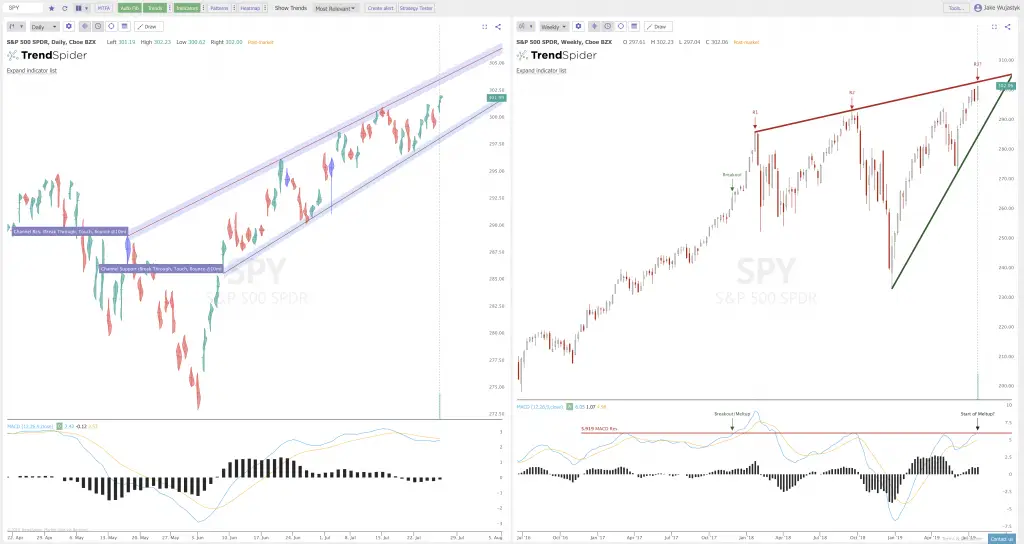
This is a Guest Post by Troy Bombardia of BullMarkets.co. Last week we explained why the market’s short term outlook is bearish. The stock market is now making a pullback, and trade war news isn’t helping bulls. Over the past year, tariff-related news has not been good for stocks in the short term. Technicals (short term, next 1-3

The Probability that the Stock Market Selloff is Over Read More »

Screen Shot 2019 08 02 at 2.27.49 PM

The Trendlines and Fibonacci Levels to Watch Next Week

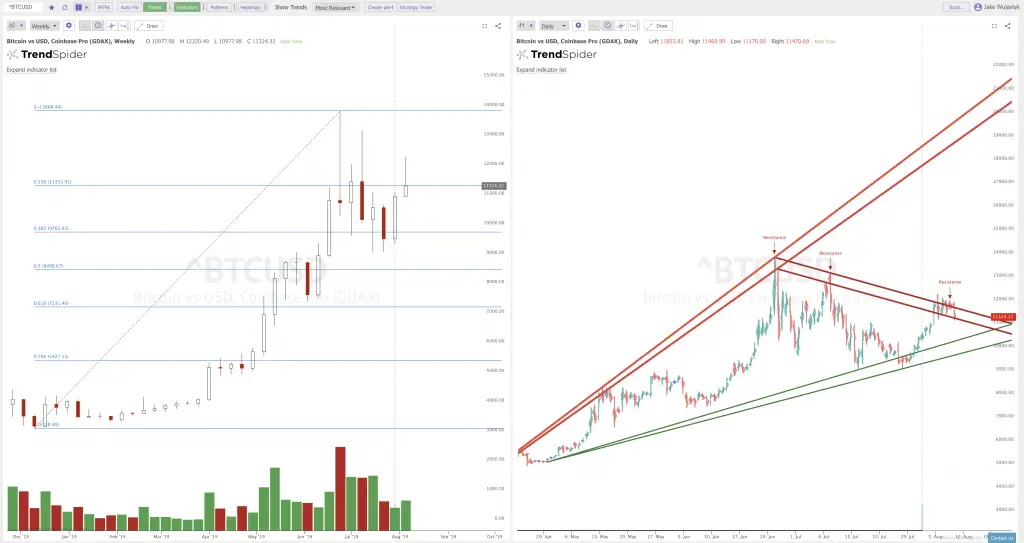
This is a Guest Post by Jake @TrendSpider.  In this weekend’s analysis, we take a look at the broad market ETF daily Raindrop Charts (TM) and weekly hollow candles into the first full week of August and compare how the crypto weekly charts are looking. To learn more about Raindrop charts and the platform in general,

The Trendlines and Fibonacci Levels to Watch Next Week Read More »