The $SPY Chart’s Blurred Lines: 5/6/18
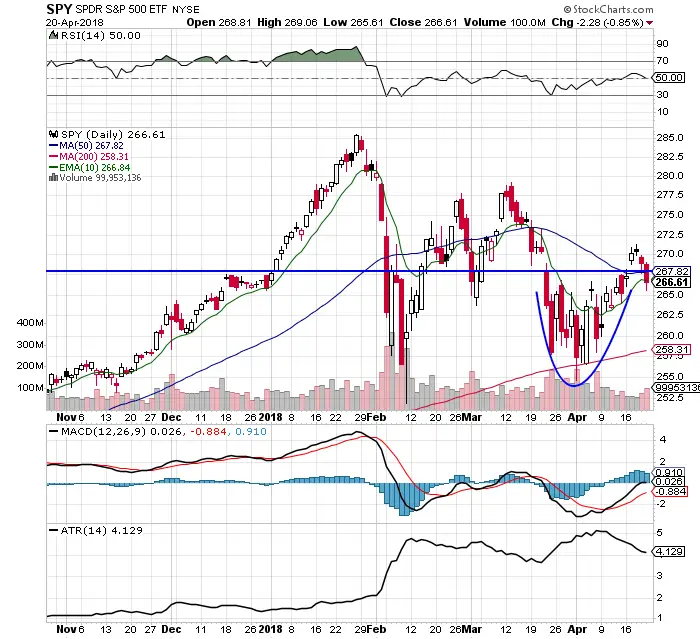
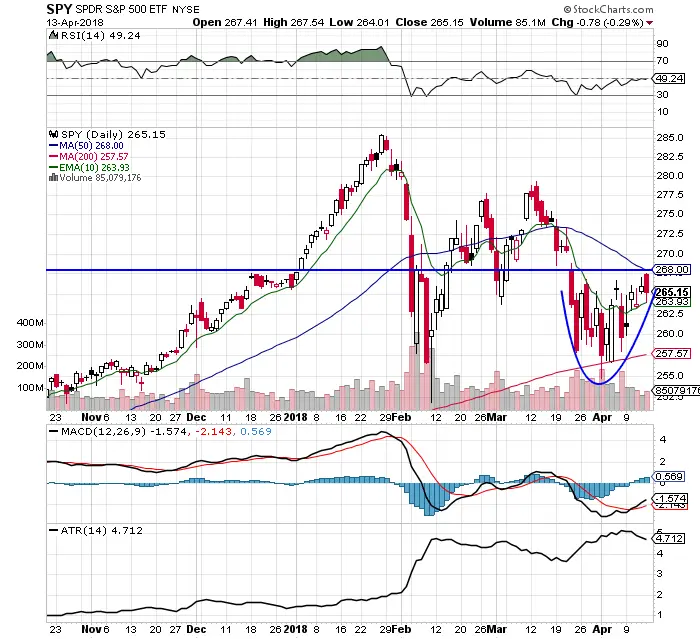
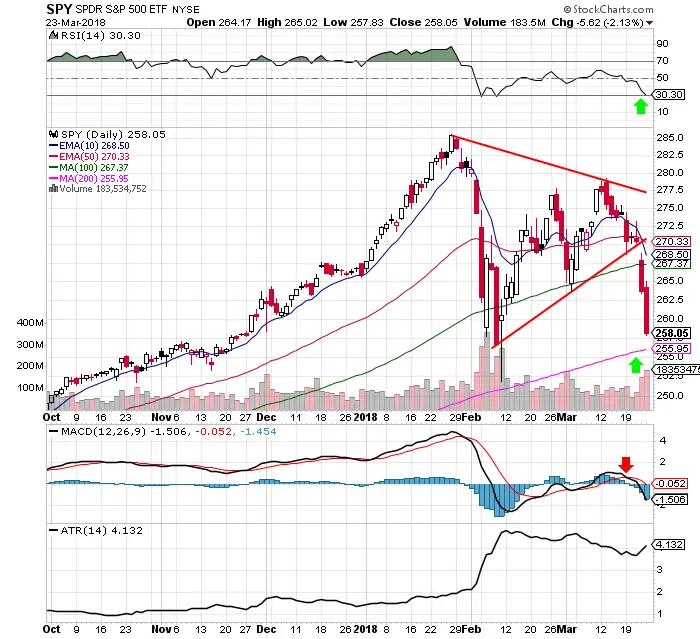
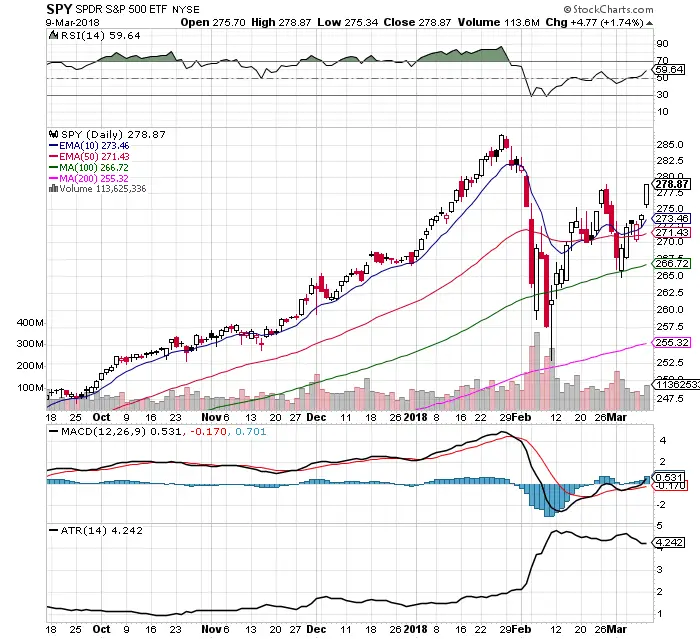
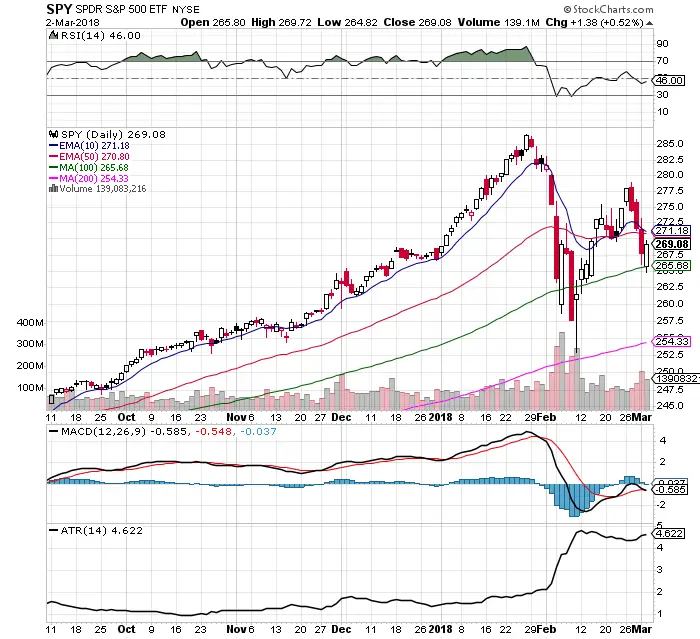
For the past 10 days short term chart resistance was at $268. Since March 22nd the 100 day SMA has been resistance with support at the 200 day SMA. The 50 day EMA acted as resistance on Friday after the strong rally inside the range. Price remains under the 100 day SMA. The chart […]
The $SPY Chart’s Blurred Lines: 5/6/18 Read More »
