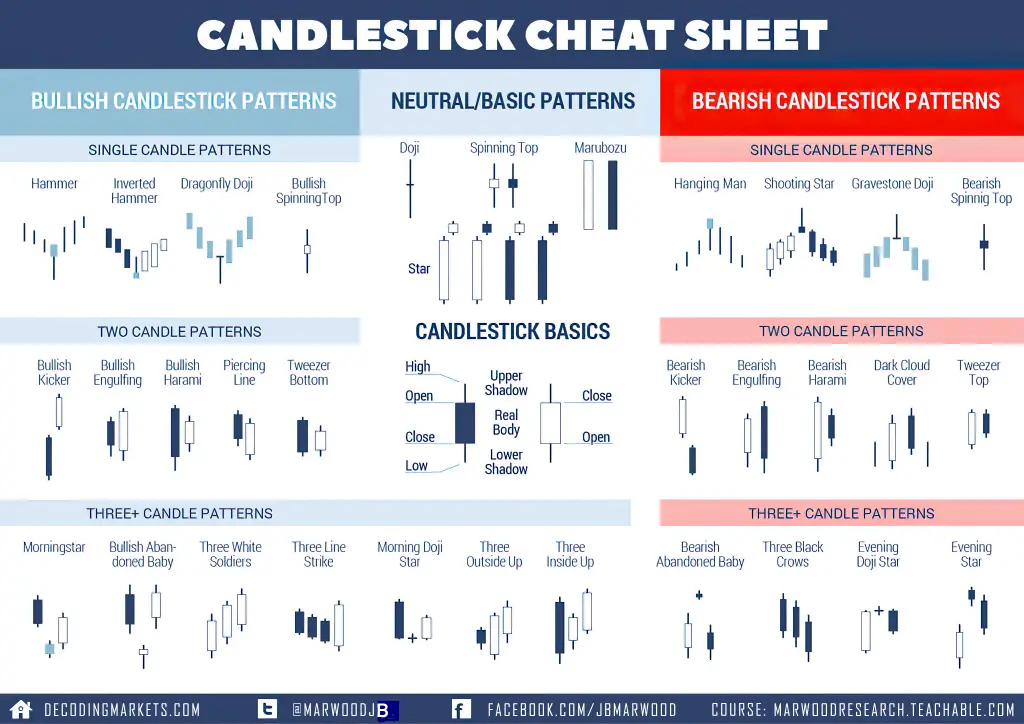
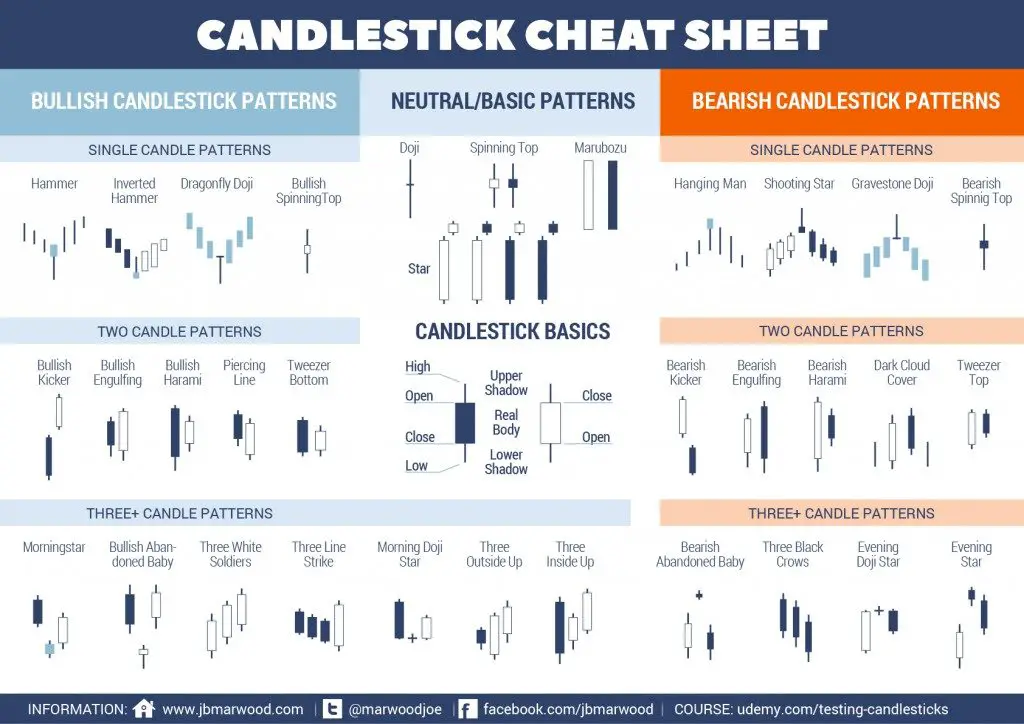
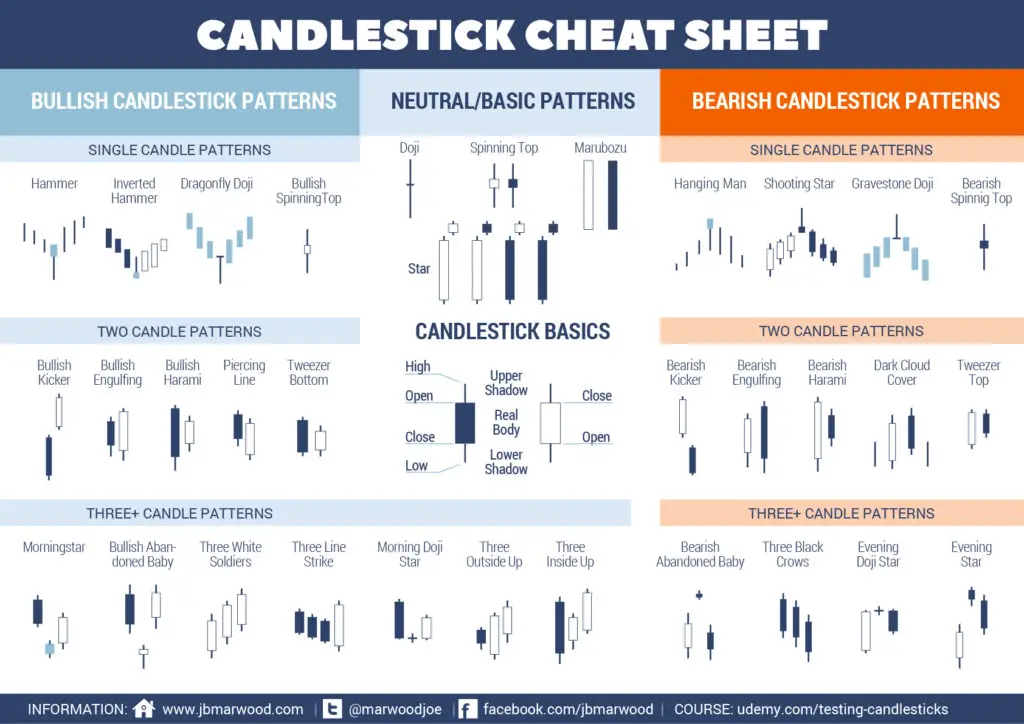
candlestick patterns cheat sheet

candlestick patterns pdf

Candlestick Patterns PDF

Here is the link to a free Candlestick Patterns PDF Guide created by Rayner Teo. A summary of what this PDF explains: How to understand candlestick patterns in less than 60 minutes to avoid spending countless hours trying to understand all the different patterns that exist. The key principles to reading candlestick patterns to better […]

Candlestick Patterns PDF Read More »
candle pattern cheat sheet

The Ultimate Candle Pattern Cheat Sheet

The Ultimate Candlestick Pattern Cheat Sheet How to Read Candlesticks A candlestick is a type of chart used in trading as a visual representation of past and current price action in specified timeframes. A candlestick consists of the ‘body’ with an upper or lower ‘wick’ or ‘shadow’. Most candlestick charts show a higher close than

The Ultimate Candle Pattern Cheat Sheet Read More »

Visual Index of Chart Patterns

Here is a visual index of all the most popular chart patterns used by traders to visually trade price action in the path of least resistance. The most misunderstood concept of using chart patterns to trade is that the edge doesn’t come from their ability to predict the future or their win rate. The edge

Visual Index of Chart Patterns Read More »

Printable Candlestick Patterns Cheat Sheet PDF

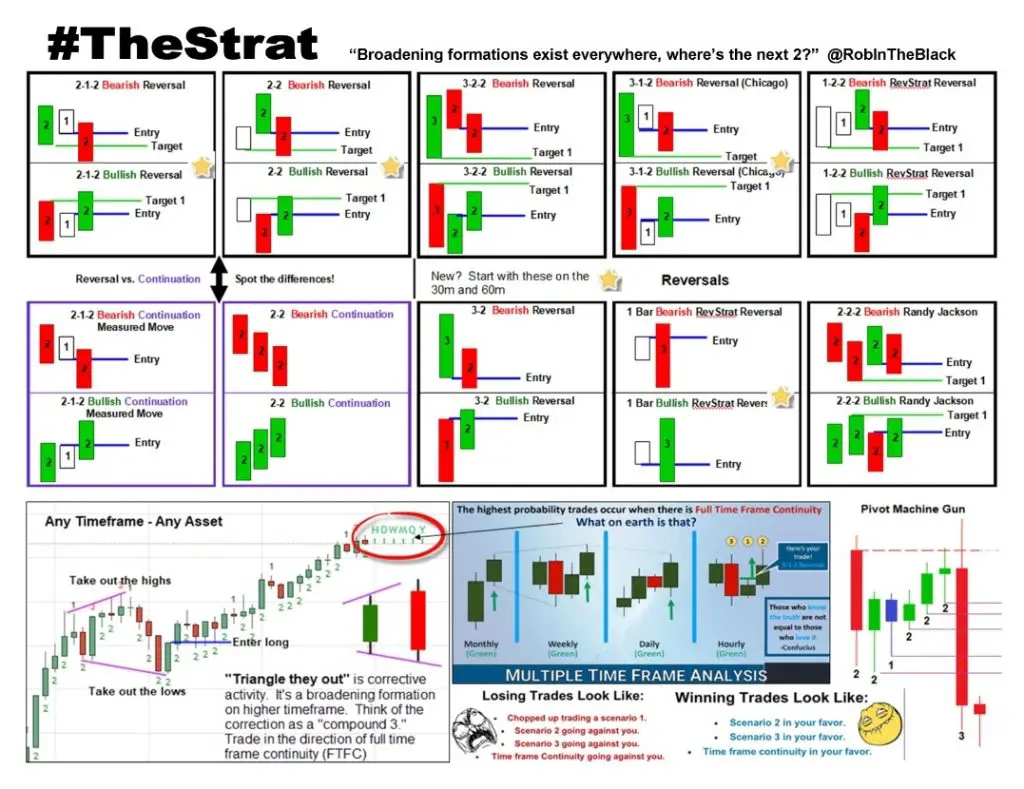
Here is the candlestick patterns cheat sheet for The Strat Combos trading strategy created by Rob F. Smith.  This image started as a sketch from Sara Strat Sniper and was turned into an infographic cheat sheet by Kostchamore on Twitter.  Printable Candlestick Patterns Cheat Sheet PDF TheStrat Combo Sheet-> Here Sara’s Ultimate Strat Guide. Must

Printable Candlestick Patterns Cheat Sheet PDF Read More »

Candlestick Pattern Cheat Sheet

Candlestick Cheat Sheet

Here is the great candlestick patterns cheat sheet for Rob F. Smith’s The Strat that was created by Sara Strat Sniper that explains the signals they trade from entry to exit using this strategy.  Image created by @TradeSniperSara You can subscribe to Sara’s YouTube channel here to see videos where she explains The Strat in detail. 

Candlestick Cheat Sheet Read More »

Trading Was Hard Until I Understood These 3 Concepts

The Complete Guide to Technical Analysis Price Patterns

Website Articles Table of Contents with Links: What is Technical Analysis? Does Technical Analysis Work? What causes a Chart Pattern? How to Draw Trendlines on a Chart Bullish Pennant pattern Bullish Flag pattern Bearish Flag pattern Rising Wedge pattern Falling Wedge pattern Triangles pattern Symmetric Triangles pattern Ascending Triangles pattern Descending Triangles pattern Cup and

The Complete Guide to Technical Analysis Price Patterns Read More »

how to read candlestick charts

Types of Candlesticks and Their Meaning

A candlestick chart is a type of visual representation of price action used in technical trading to show past and current price action in specified timeframes.   Most candlestick charts will reflect a higher close than the open as represented by either a green or white candle with the opening price as the bottom of the

Types of Candlesticks and Their Meaning Read More »