As a trader, your success depends on your ability to identify chart patterns that can help you capture directional market movements. The bullish and bearish harami candlestick patterns are two such patterns that can provide valuable insight into potential trend reversals. The bullish harami, which consists of a small bullish candle that falls within the previous bearish candle, can signal the end of a downtrend and the start of an uptrend. The bearish harami, on the other hand, is the opposite and can signal the end of an uptrend and the beginning of a downtrend. In this article, we’ll look at these patterns and how you can use them to improve your trading strategy.
Bullish Harami Candlestick Pattern – A Reversal Signal to Watch Out For
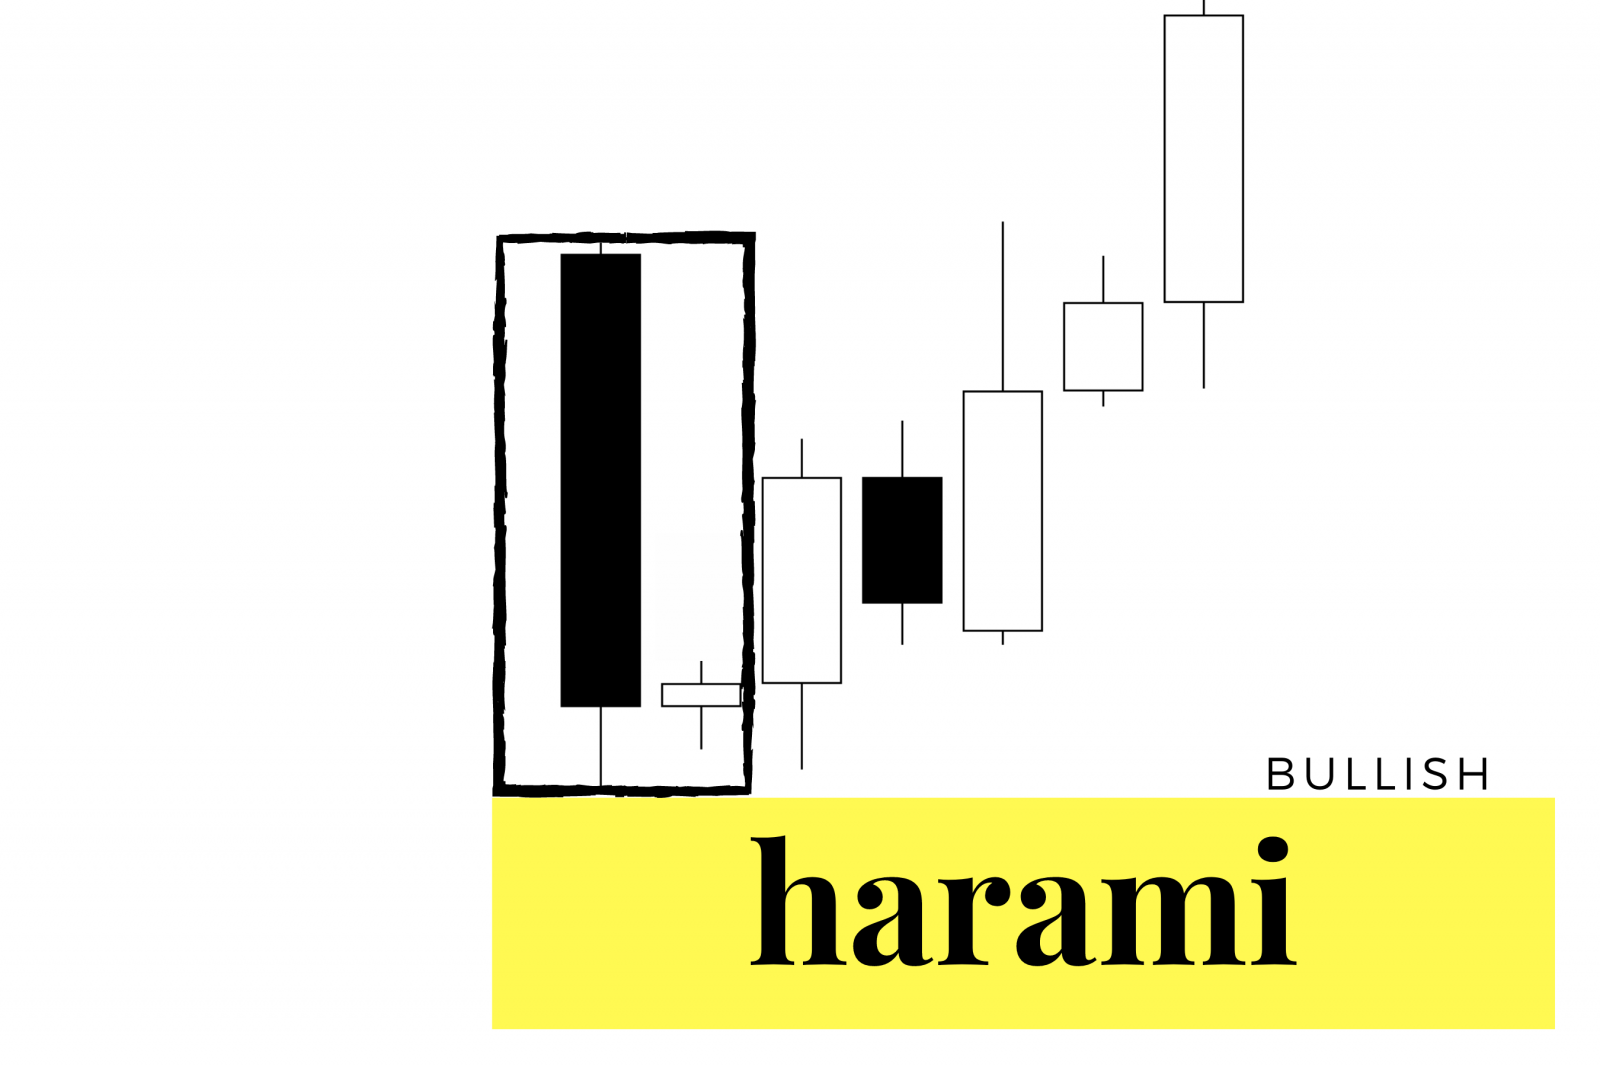
If you’re looking for a chart pattern that can signal the start of a reversal in a downtrend, the bullish harami might be worth watching for. This minimum two-candle pattern typically consists of a small bullish candle with a price range that falls within the previous bearish candle that closed lower. While it can appear at any point during a price range, it has the most significance during a chart’s downtrend as it can signal that the low is in and that the chart may be ready to reverse.

Understanding the Bullish Harami Candlestick Pattern
The term “harami” comes from the Japanese word “pregnant.” This candle pattern is often used metaphorically to describe a large bearish “mother” candle that is “pregnant” with a smaller bullish “baby” candle.
When analyzing the pattern, traders often look at the second bullish candle to see if it’s a doji. If so, it can indicate that sellers could not drive prices any lower, and bullish sentiment set in, causing it to close higher than the open. Additionally, volatility tends to contract during this pattern, and the smaller trading range suggests greater agreement by traders at these prices.
The Bullish Harami as a Reversal Signal
As mentioned, the bullish harami is typically seen as a reversal signal during a downtrend. This is because no newer low in price is set, and it shows a high probability signal for a reversal back to higher prices. The pattern tends to have better odds of working when it occurs on a chart in an oversold area, such as a 30 RSI or a lower 2nd or 3rd deviation from the 20-day moving average.
In conclusion, the bullish harami candlestick pattern is valuable for traders identifying potential reversal signals. By understanding the mechanics of this pattern and the conditions that tend to make it more effective, traders can add it to their arsenal of technical analysis tools and use it to make more informed trading decisions.
Bearish Harami Candlestick Pattern: A Bearish Reversal Signal in Trading
If you’re a trader, you know the importance of identifying trends and reversals in the market. One tool that can help you with this is the bearish harami candlestick pattern. Let’s look at this pattern, its characteristics, and how to use it in your trading strategy.

Understanding the Bearish Harami Candlestick Pattern
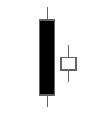
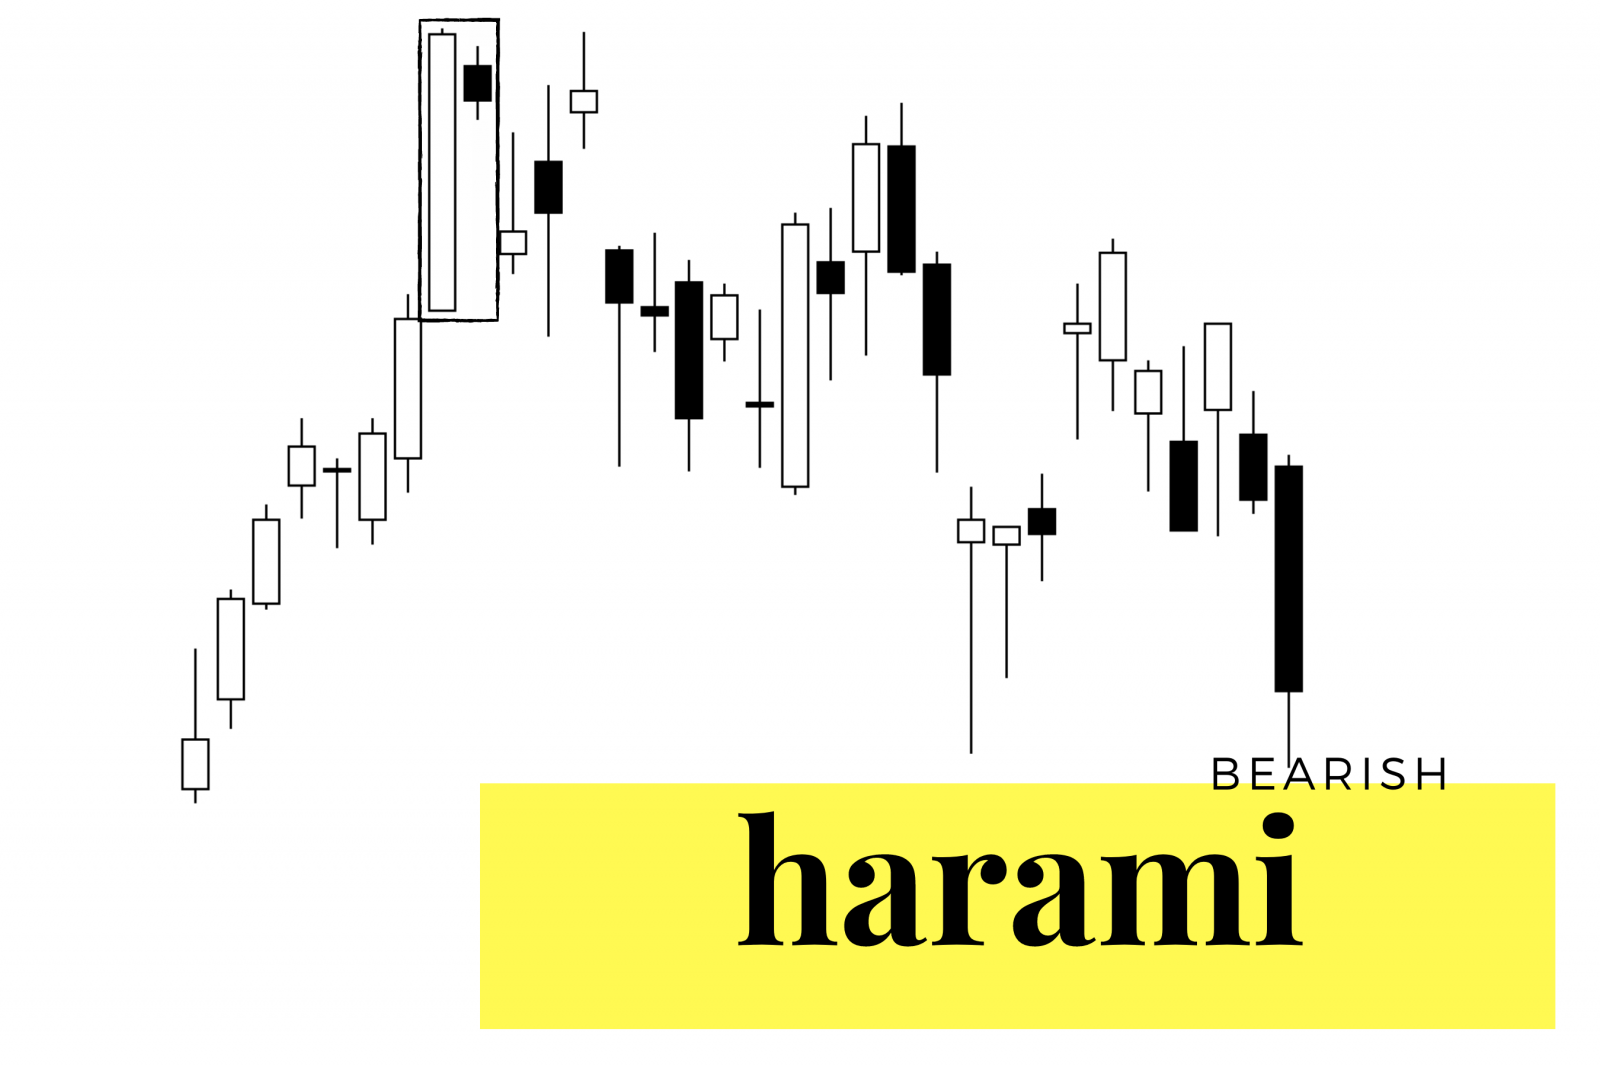
The bearish harami is a two-candlestick pattern that signals the potential for a reversal during an uptrend. The first candlestick is a large bullish candle, followed by a smaller bearish candlestick. The first candlestick’s body must fully engulf the opening and closing prices of the second candlestick. This pattern is bearish, suggesting that the uptrend may be losing steam and could reverse direction.
Interpreting the Size and Range of the Second Bearish Candle
The size and range of the second bearish candle can provide insight into the probability of a reversal. A smaller bearish candlestick indicates a higher likelihood of a drop to lower prices. This is because a small bearish candlestick signals buyers are no longer present at higher prices, and the price has lost momentum.
Using the Bearish Harami to Manage Your Trades
The bearish harami can lock in profits for long positions during uptrends, as it suggests that the uptrend may end. The second bearish candle confirms that the high on the chart may be in for now. A short position trade can be taken at the end of the second bearish candle signal, with a stop loss on the move above that bearish candle. Price targets can be placed for previous support levels on the chart in price or using a technical indicator like the RSI or a moving average.
Confirming the Bearish Harami with Other Indicators
You can look for additional confirmation to increase the probability of a successful trade. One way to do this is to look for the bearish harami near the overbought 70 RSI on a chart or at three or more standard deviations above the 20-day moving average. This pattern also confirms if the next candle after these first two is also bearish.
Conclusion
The bearish harami candlestick pattern is a valuable tool for traders identifying potential reversals in an uptrend. The bullish harami candlestick pattern is a helpful tool for traders identifying possible reversals in a downtrend. By understanding the characteristics of this pattern and how to interpret its signals, you can improve your trading strategy and make more informed decisions. Remember that no trading strategy is foolproof. Managing your risk through proper position sizing and using stop losses to protect your capital is essential for long-term success and, in many cases, just surviving losing streaks to get to the big winners.

