What Is a Cup and Handle Pattern?
The Cup and Handle is a chart pattern commonly used by traders to identify potential bullish setups in the stock market that could signal a coming bullish trend to the upside. This article will discuss the Cup and Handle pattern in detail, explain how it works, and provide examples.
Understanding the Cup and Handle Pattern
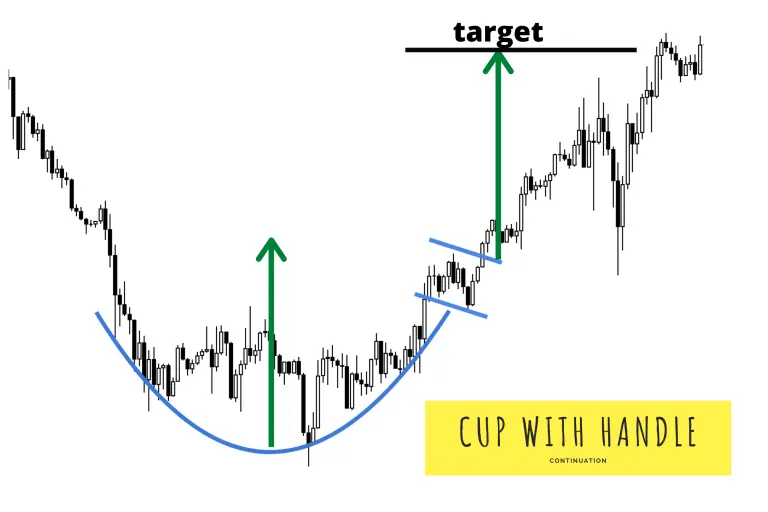
The Cup and Handle pattern is a bullish continuation pattern that signals an uptrend in the market. It is formed when a stock’s price undergoes a rounded bottom formation, followed by a brief period of consolidation before continuing its upward trend.
The rounded bottom part of the pattern resembles a cup, while the following consolidation period is called the handle. The handle is a period of indecision where the stock’s price may fluctuate before continuing its upward trend. Most handles in this pattern tend to swing in price to the downside.
The Cup and Handle pattern is typically used to identify a bullish chart pattern in a stock under early accumulation, indicating that the stock will likely continue its upward trajectory after a breakout of the handle pattern following the cup.
How to Identify the Cup and Handle Pattern
Traders look for specific chart pattern characteristics to identify the Cup and Handle pattern. These include:
- Cup Formation – A rounded bottom that resembles a cup.
- Handle Formation – A period of consolidation where the price fluctuates inside a range, usually moving lower.
- Breakout – A price movement that exceeds the handle’s upper limit following the handle.
Once these characteristics are identified, traders may use the pattern to identify potential buying opportunities. This pattern is a momentum breakout strategy signaling the high probability that an uptrend will occur following the pattern that likely worked through sellers.
Is a Cup and Handle Pattern Bullish?
Traders often use the Cup and Handle pattern to identify bullish trends in the stock market. Once the pattern is identified, traders may use it to trade potential price movements in the stock.
Traders may also use the pattern to set stop-loss orders, which can limit their losses in the event of an unexpected price movement back lower inside the previous cup pattern.
Example of a Cup and Handle
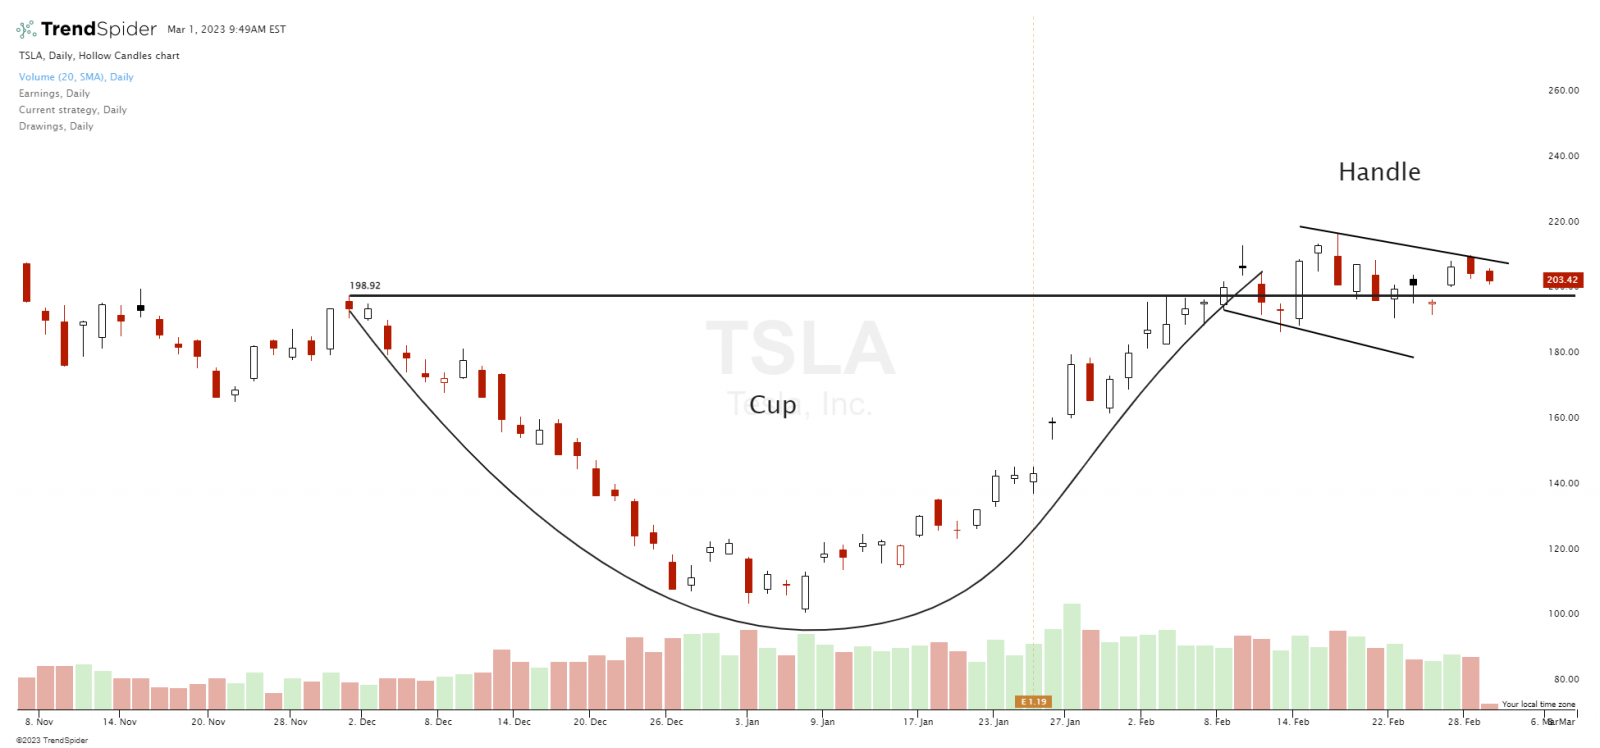
Let’s look at a real-world example of the Cup and Handle pattern. The chart below shows Tesla Inc.’s (TSLA) price movement from November 2021 to January 2022.

Chart Courtesy of TrendSpider.com
Tesla Cup and Handle Pattern:
- Rounded Bottom (Cup)
- Brief Consolidation (Handle)
- Breakout Above Handle
- Traders: Bullish Trend Identified
As you can see, the stock’s price movement forms a rounded bottom (Cup) in January 2022, followed by a brief period of consolidation (Handle). In February 2022, the price broke out above the cup, indicating a potential bullish trend in the stock.
Traders who identified the Cup and Handle pattern in this stock may be able to capitalize on a future bullish trend by purchasing shares when the price breaks out above the handle and starts a new uptrend. So far, this cup and pattern has not had a sustainable uptrend in price action but is one to watch for in the future.
How to Trade the Cup and Handle
Here are some steps that traders typically follow when trading the Cup and Handle chart pattern:
- Identify the Cup and Handle pattern: The Cup and Handle pattern is identified by a curved U-shaped cup, followed by a short consolidation period and then a smaller, downward-sloping handle. Traders usually look for this pattern on the daily or weekly chart.
- Look for a breakout: Traders wait for a breakout once the Cup and Handle pattern is identified. A breakout occurs when the stock price breaks out above the previous resistance level, which is the top of the handle. This is usually accompanied by high trading volume.
- Confirm the breakout: Traders usually wait for confirmation of the breakout before making a trade. This confirmation can come from continued upward momentum and increasing trading volume.
- Enter the trade: Once the breakout is confirmed, traders can enter a long position in the stock. Some traders may wait for a pullback or a retest of the breakout level before entering the trade.
- Set stop-loss and take-profit levels: Traders should always set stop-loss and take-profit levels to manage risk and maximize profits. Stop-loss levels limit losses if the trade goes against the trader immediately after the entry, while take-profit levels lock in profits when the original price goal is reached.
- Monitor the trade: Traders should monitor the trade closely and adjust their stop-loss and take-profit levels as the trade progresses. They may also choose to exit the trade if the stock price fails to continue its upward momentum. Trailing stops can manage the open profits on a winning trade by locking in remaining profits on any sudden reversal and breakdown of the uptrend.
Limitations of the Cup and Handle Pattern
While the Cup and Handle pattern is a widely used and popular technical analysis tool, it has some limitations that traders should be aware of:
False signals: Like any technical analysis tool, the Cup and Handle pattern can produce false signals. For example, the pattern may form, but the stock price may not break out as expected. Traders should always look for confirmation of the breakout before entering a trade.
Timeframe: The Cup and Handle pattern is most effective on longer-term charts such as daily or weekly charts. The pattern may not be as reliable on shorter-term charts, and false signals may be more common.
Market conditions: The Cup and Handle pattern is bullish and may not work well in bearish market conditions. In a bear market, the stock price may break out of the pattern but reverse and continue declining.
Volume: The Cup and Handle pattern is most effective when accompanied by high trading volume on the right side of the ascending cup and at the breakout of the handle. If the breakout occurs on low volume, it may not be a strong signal.
Subjectivity: The Cup and Handle pattern can be a subjective tool, and different traders may interpret it differently. Traders should know this subjectivity and use other technical analysis tools to confirm the pattern. A confluence with other technical indicators increases the odds of success.
In summary, while the Cup and Handle pattern can be useful for traders, it’s essential to be aware of its limitations and use it with other technical analysis tools to make informed trading decisions.
Conclusion
In conclusion, the Cup and Handle is a classic chart pattern that is a technical tool traders use to identify potential bullish trends in individual stocks in the stock market. By understanding the characteristics of the pattern and using it to trade potential price movements, traders can make informed trade management decisions.
If you’re looking to identify bullish trends in the stock market, keep the Cup and Handle pattern in mind. With its ability to signal bullish trends, this pattern is a valuable tool for traders who want to stay ahead of the market.
