What Is a Flag?
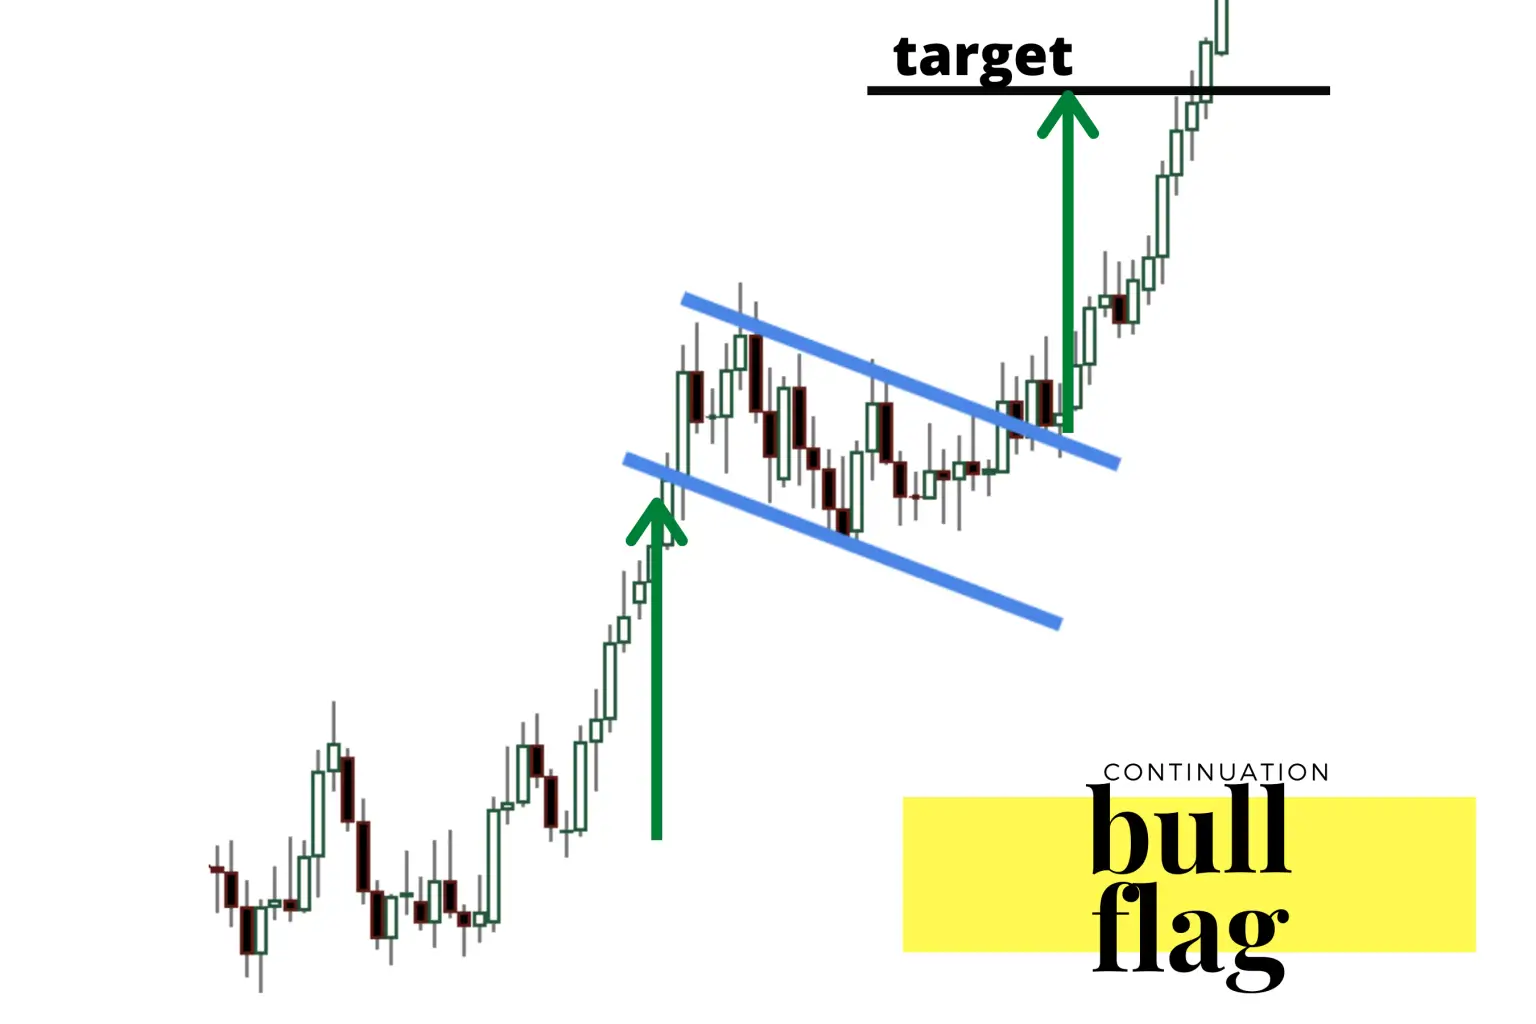
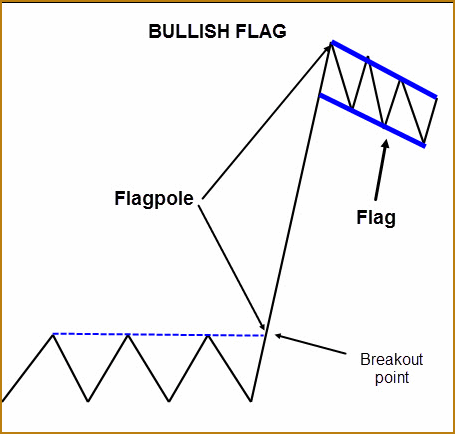
A flag pattern on a chart is when price action trades within a range for long enough to look like the shape of a flag. The flags must take place after an uptrend in price action to put it in proper context on a chart. The bullish flag pattern must have a preceding uptrend to create a pole, followed by a price range to create the flag. The most popular version of the bullish flag pattern has a slightly descending range for the flag, with lower highs and lower lows.
A bearish flag pattern is when a downtrend is followed by a slightly ascending trading range creating an inverse flag and pole. This post will only discuss the more popular bull flag pattern.
What Is a Bullish Flag?
The bullish flag is a continuation pattern signaling a high probability that the last uptrend continues after the range is completed. The bull flag signals a consolidation period on a chart in a sustained uptrend. The fact that the chart made a new higher trading range instead of falling lower makes it bullish. The bullish flag is seen as a pause in an existing uptrend that is working through supply before continuing higher.
How a Flag Pattern Works
- The bull flag is a continuation pattern of the previous uptrend.
- A bull flag chart pattern occurs after an uptrend that looks like a pole.
- The previous uptrend visually represents the pole before a price consolidation.
- The flag is a slightly descending rectangular price range after the uptrend to new higher prices ends. The flag has primarily lower highs and lower lows.
- The signal of the end of the flag pattern and the beginning of a new potential uptrend is when the descending upper trend line is broken with a move upwards in price.
- This pattern is thought to be the consolidation of the previous uptrend.
- Traditionally the move out of the flag is thought to be potentially as big in magnitude as the uptrend before the flag begins.
- A breakout of the flag with higher than-normal volume increases the chance of a continuation of the uptrend.
- A stop loss can be set at the lower trend line in the flag after entry or a reversal and close back under the old upper trend line.
Flag Pattern Example

How to Trade a Flag Pattern
- Pick a watchlist of growth stocks with the potential for large moves.
- Identify the pattern on a chart by locating an uptrend followed by a high descending price range. The daily chart is usually the best time frame for this pattern.
- Identify the upper trend line on the flag with a drawing tool connecting the lower highs in the range. Set your buy signal for a break and close above that line.
- Your profit target could be a 50% to 100% move of the previous trend before the flag range.
- Set your stop loss tight on a close back under that trend line, or give it more room with a stop loss in percentage terms or halfway into the trading range of the flag.
- A trailing stop can be moved up on the trade during an uptrend to lock in profits if there is a reveal. Short-term moving averages, previous-candle lows, and price percentage retracements can all be used as trailing stops.
Key takeaways:
The flag and pole pattern is a very bullish pattern on a chart that can be signaling a chart is about to go much higher in price. As with all trades, a risk/reward ratio should be quantified at entry and the trade managed to optimize wins and minimize profits.
