We have two primary sources that drive home prices, buyers demand and sellers supply. The main reason we didn’t see a housing crash in 2022 is that while the demand has dropped due to factors of financing costs and inflationary pressures on personal budgets at the same time sellers are in short supply, especially in popular areas. The supply side is still short going into 2023 by historical standards.
Sellers have pulled back from selling if they didn’t get their listed price after seeing so many houses sell above list price for years and even bidding wars being common. Other sellers have even held off listing their house at all if prices in there area have dropped.
While house prices in some cities and states have come down in recent months, many other areas have continued to go higher. U.S. home prices are still up overall year-over-year but the rate of price growth itself is slowing. It does look like the U.S. housing market as a whole has reached a near-term peak as prices decelerate and few metropolitan markets make new all time highs, bidding wars become less and less normal, and reductions in prices become more common with the lack of demand of high priced homes due to high interest rates.
A reversal from an accelerating all-time high in price movement is much different than a crash. To confirm a housing crash we need homes to be sold in the market at prices at least 20% below previous high values.
According to the S&P Case-Shiller Index, home values were down 2.6% between June and September of 2022. They’re still up 7.81% year over year, but the momentum of the short-term decreases show a housing market top may be in on a national level.
Geographic movements
There is a wide variance of home price trends across the country with the most speculative real estate markets that saw the highest price increases also being the ones primarily with the biggest price drops this year from the peak. The higher the increase over the past two years in a real estate market the higher the chance of a price drop in most areas. Speculation and bidding wars created unsustainable price values that can’t hold up under normal conditions.
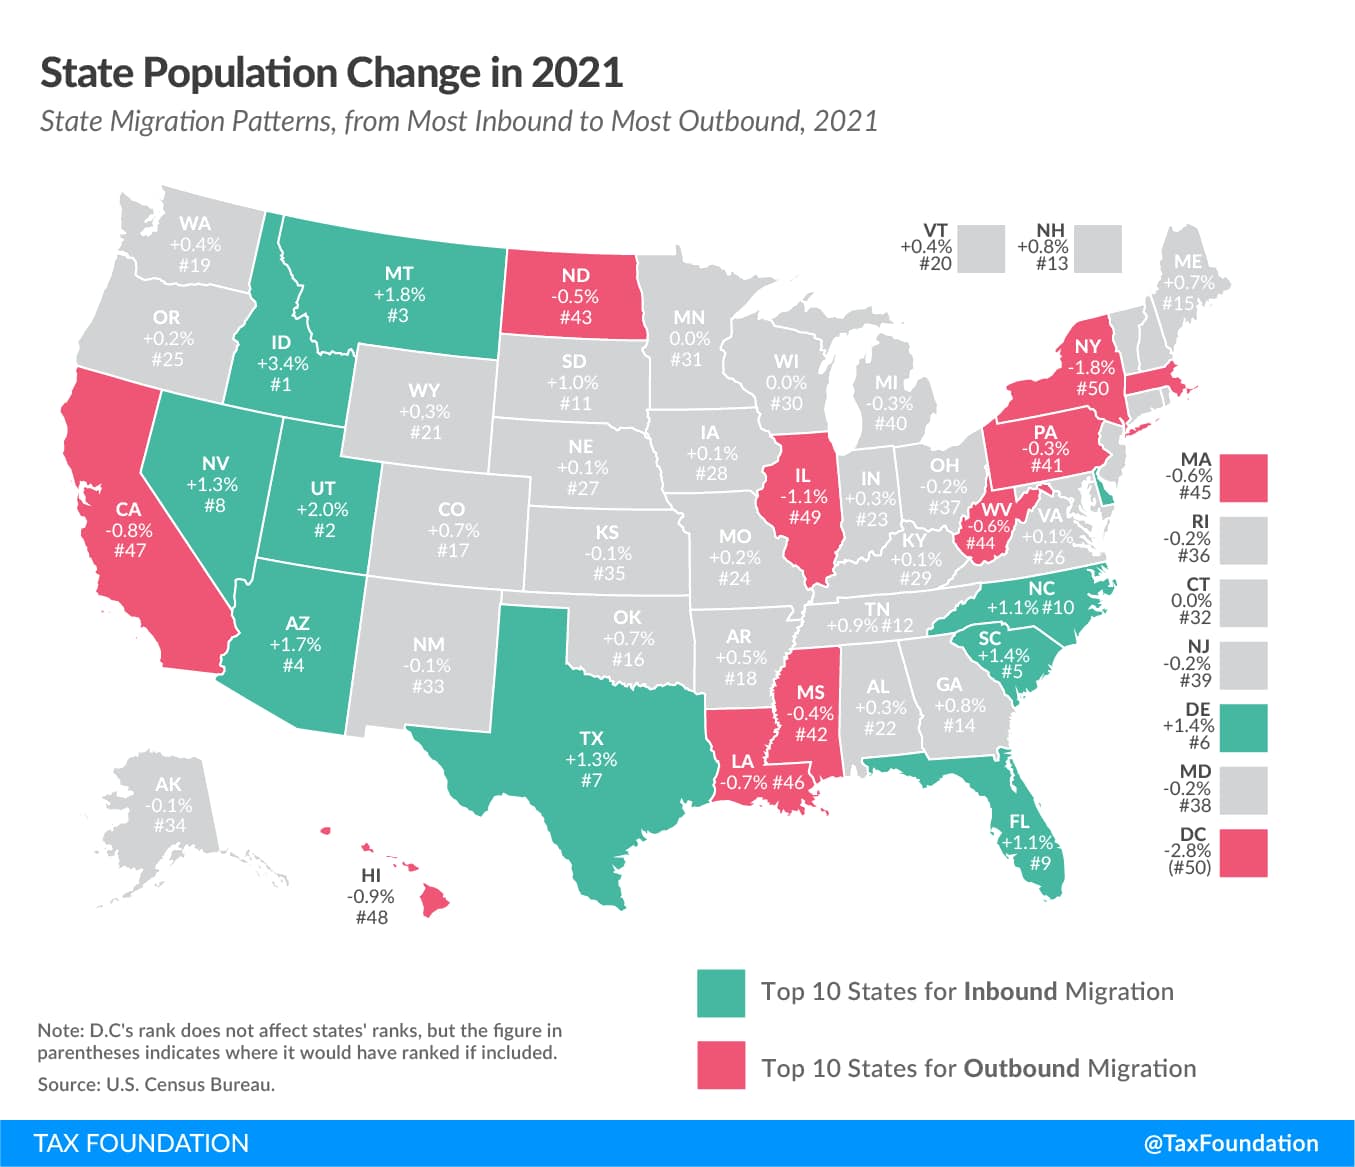
Another factor for whether a specific housing market has already fallen is whether it’s an outbound area with a net population loss or a desirable high migration area gaining population.
In many states we see people moving out of cities and into suburbs or more rural areas. On a national level we see people moving out of some states and into others. With Illinois, California, and New York the states having the biggest net loss with Midwest states picking up the most population along with Florida, Texas along with the Carolinas are the next biggest population gainers. The motivation to move can be due to cost of living, wanting to profit from the equity in a current home, or for political reasons. These movement patterns have a huge effect on specific housing market outcomes on a city and state level.
Top ten outbound metro areas
- San Francisco, CA
- Los Angeles, CA
- New York, NY
- Washington D.C.
- Boston, MA
- Chicago, IL
- Louisville, KY
- Detroit, MI
- Denver, CO
- Seattle, WA

Number of homes for sale (Inventory/Supply)
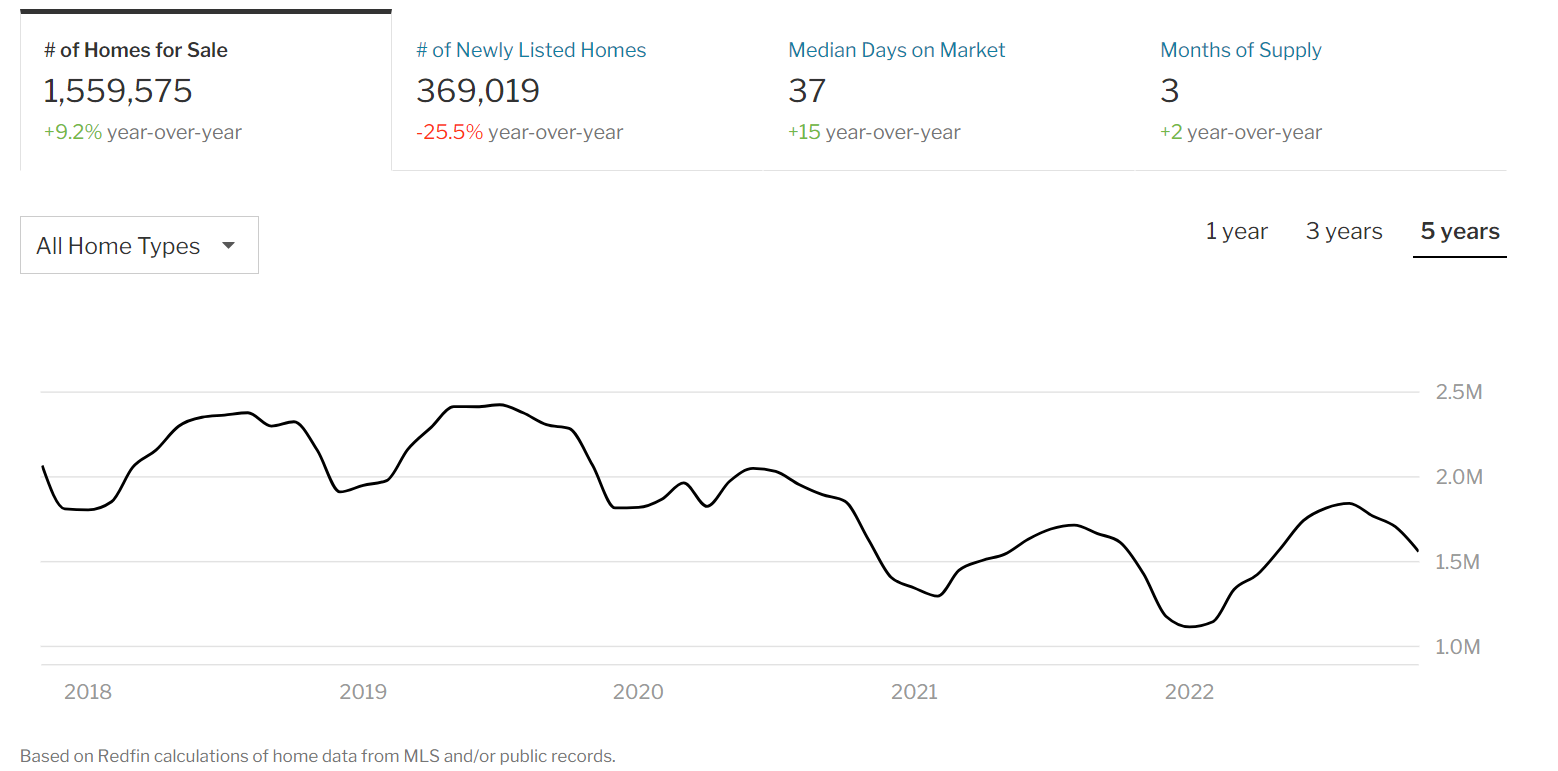
On the supply side there are still 600,000 less homes for sale than before the pandemic. If compared to 2018 and 2019 the housing market has 26% less home listings than before the pandemic began.
While homes for sale have increased 9.2% year-over-year, newly listed homes has dropped by over a fourth. Showing sellers are less motivated to sale in this market.
After the strong housing market of the past two years, home owners are not motivated to sell at this time and supply is just not available yet to help lower prices. The high prices of the past two years helped bring a lot of homes on to the market with monetary motivation. As prices drop it lowers their motivation to sell.
It is going to take a longer time than expected for prices to return to the historical average. This could happen by homes just not going higher for years to average out prices and catch up with inflation which is real estates historical correlation outside speculative bubbles.

Rising mortgage rates 2022 chart
In 2022, 30-year mortgage interest rates started at approximately 3% and rose to over 7% at the peak. While the high interest rates have dramatically increased the mortgage payments of new buyers it’s not drastically different from historical standards before the age of low interest rates.
Buyers can still buy houses even if they may not be able to afford as much house as before the rate hikes and just plan to refinance at some point in the next few years when rates come down. 7% interest rates doesn’t make it impossible to buy a home, that was normal in the 20th century and even a good rate to have.
Number of homes sold is falling
According to Redfin, in November 2022, U.S. home prices were up 2.9% compared to the same month last year, selling for a median price of $393,977. On average, the number of homes sold was down 37.4% year over year and there were 376,001 homes sold in November this year, down 600,253 homes sold in November of 2021. The national average 30-year fixed rate mortgage rate is at 6.8% currently, up 3.7% year over year.
The volume of sales have decreased a lot, the prices of homes has not decreased a lot in correlation with less transactions yet.
Average Sales Price of Houses Sold for the United States
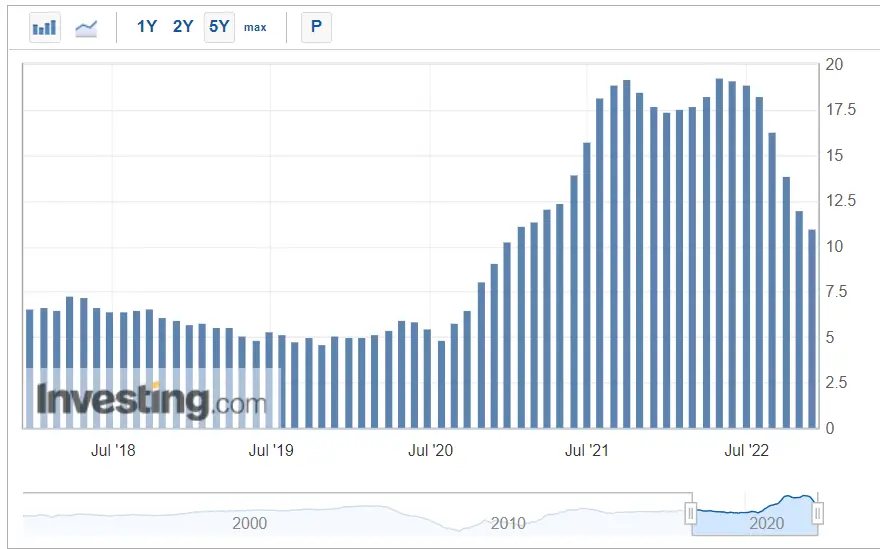
U.S. House Price Index YoY
The rate of home price increases has slowed showing the end of the momentum for five straight months.

Chart Source Investing.com
Will house prices go down in 2023 in the US?
Yes, there is a high probability that house prices decrease in 2023 based on high interest rates and a plunge in home buying volume. The magnitude of the downtrend in home prices on a local level will likely have a high correlation to the desirability of the geographic area.
Will there be a housing market crash in 2023?
The odds are more in favor of a downtrend in overall U.S. house prices in 2023 on a national level of less than 20% from peak prices and not a drop in housing prices by more than 20% due to a lack of supply of houses on the market with sellers hesitance to sell at lower prices. Rising rents and high interest rates are also likely to keep home owners where they are and not having to rent for a higher rate than their house payment was or finance a new mortgage.
Will 2023 be a good year to buy a house?
2023 may not be the best year to buy a home due to high interest rates and home prices remaining historically high from inflationary correlations, replacement costs, and the historical moving average of prices in most markets. After houses fall at least 20% from the peak and interest rates decline back closer to 5% could be a better time to buy a house.
The housing market is also seasonal with some months being better to buy a home than others as weather, school years, and holidays can be factors on when people want to move.
Here are the best and worst months to buy a house.
Best months to be a home buyer.
- October
- November
- December
- January
- February
Worst months to be a home buyer.
- April
- May
- June
- July
- August
Anything can happen, however the odds of a housing market crash in 2023 is low due to limited supply side factors and recency bias sellers have with the recent high prices they have anchored their home value to making them less likely to sell at lower prices.
