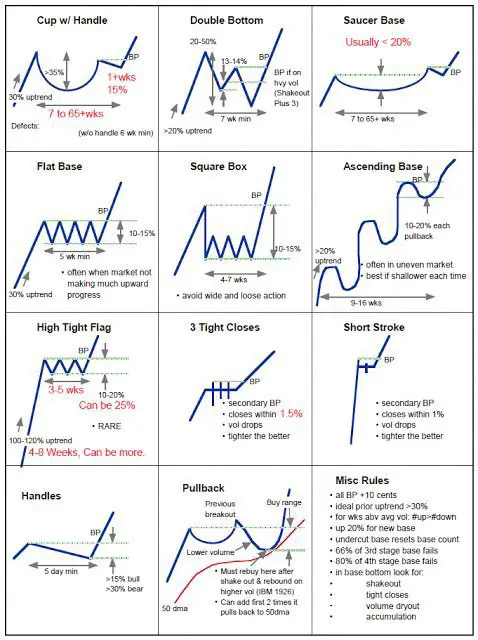
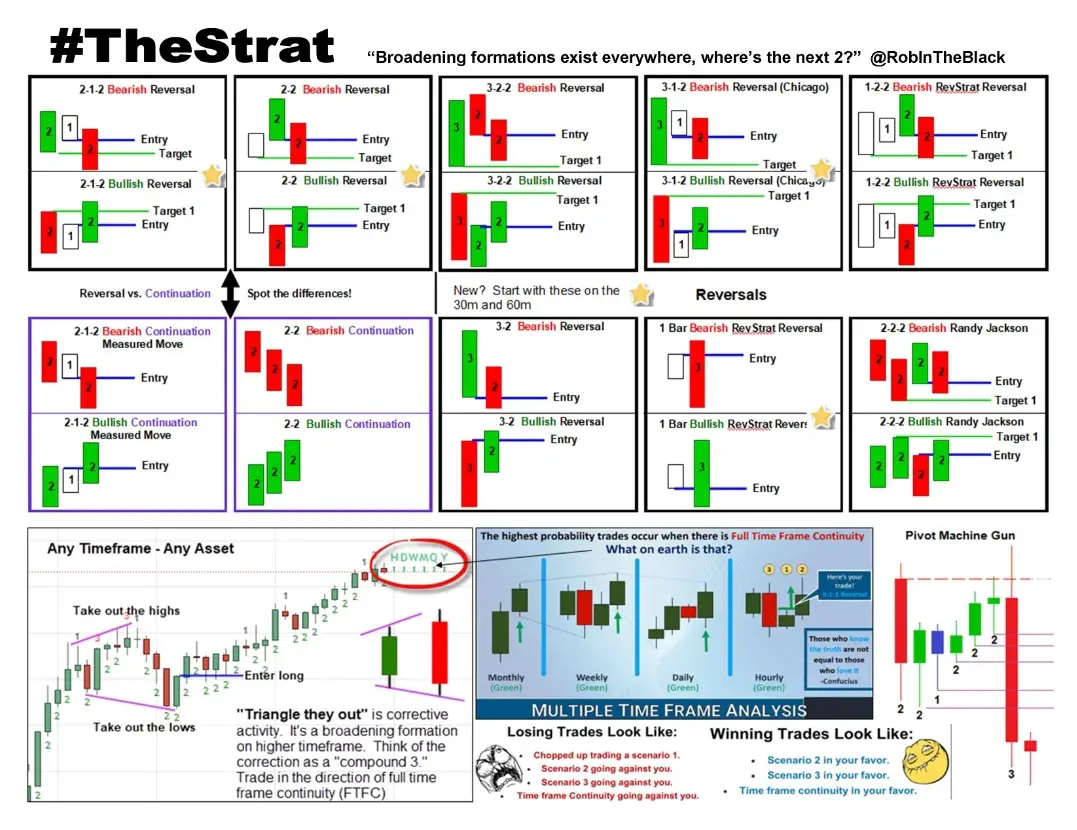
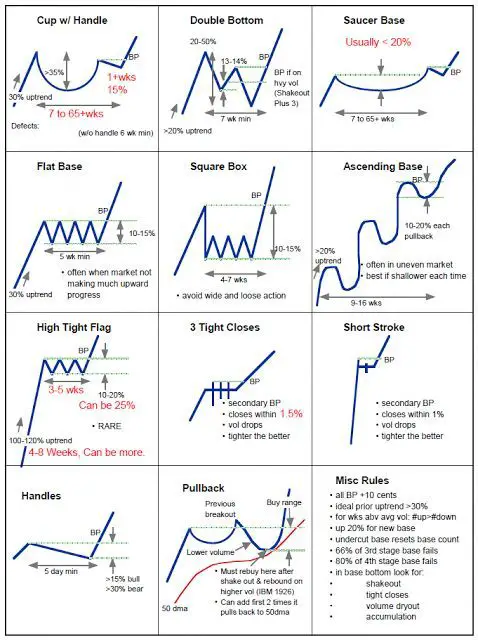
 Technical analysis is used by traders or investors to analyze charts to identify patterns in the market price action data to identify trends and trading ranges to either react to what is happening now or make predictions about the future.
There are two major types of technical analysis: predictive technical analysis and reactive technical analysis.
Reactive traders rely on trade management as the price action plays out to minimize losses and maximize gains for profitability. They rely on quantified systems to make money in the markets, not knowing the future. This is the primary type of technical analysis used by trend followers.
Technical analysis for beginners
Technical analysis focuses only on price action and volume not fundamental analysis like earnings or sales. The best use of technical analysis isn’t to try to predict the future price, but to identify the path of least resistance, quantify the probabilities of what will happen next, and to identify a price level of entry for a good risk/reward ratio when considering the variance between a technical stop loss and potential profit target.
Technical analysis is best used to identify the best price levels on a chart to use to manage a trade for the best stop loss levels, trailing stops, and profit target levels. Technical analysis is best used as a guide for managing a trade’s evolving risk/reward ratio not to predict the future.
Here are the basic terms to get you started to understand the different dynamics of technical analysis.
Price action trading
Price action patterns are the visual moves that happen on the chart from the interaction between buyers and sellers at different price levels. At the candlestick level, a trader can see the micro price action and when the trader zooms out on the chart to a higher time frame they can see the full context of the chart pattern. Price action can show that a chart is range bound, volatile, swinging in one direction in the short-term or in a longer term-term uptrend or downtrend.
Trendlines
Trendlines are ways to measure and quantify the path of least resistance for a chart in your time frame.
Trendlines are identifiers of the trend in your trading time frame.
Vertical trend lines must be drawn from left to right to identify one of the following:
- A trend of higher highs signaling an uptrend.
- A trend of higher lows for support in an uptrend.
- A trend of lower lows signaling a downtrend.
- A trend of lower highs for resistance in a downtrend.
Horizontal trendlines must be drawn straight from left to right to identify price levels of resistance based on repeating high prices that can’t be broken or levels of support based on repeating lows that hold.
Trendlines can connect end of day prices or the full daily range of prices. For candlestick charts the wicks represent intra-day prices that were outside the open or the close. Both are viable options for trend lines.
Trendlines should connect at least two price levels in a direct path to be considered viable. The more connections that a trendline makes the more meaningful it is.
Trendlines must be updated daily to ensure a trend is still in place. You want to see a connection and trend of prices in your timeframe.
Trendlines can be drawn on any time frame.
Support
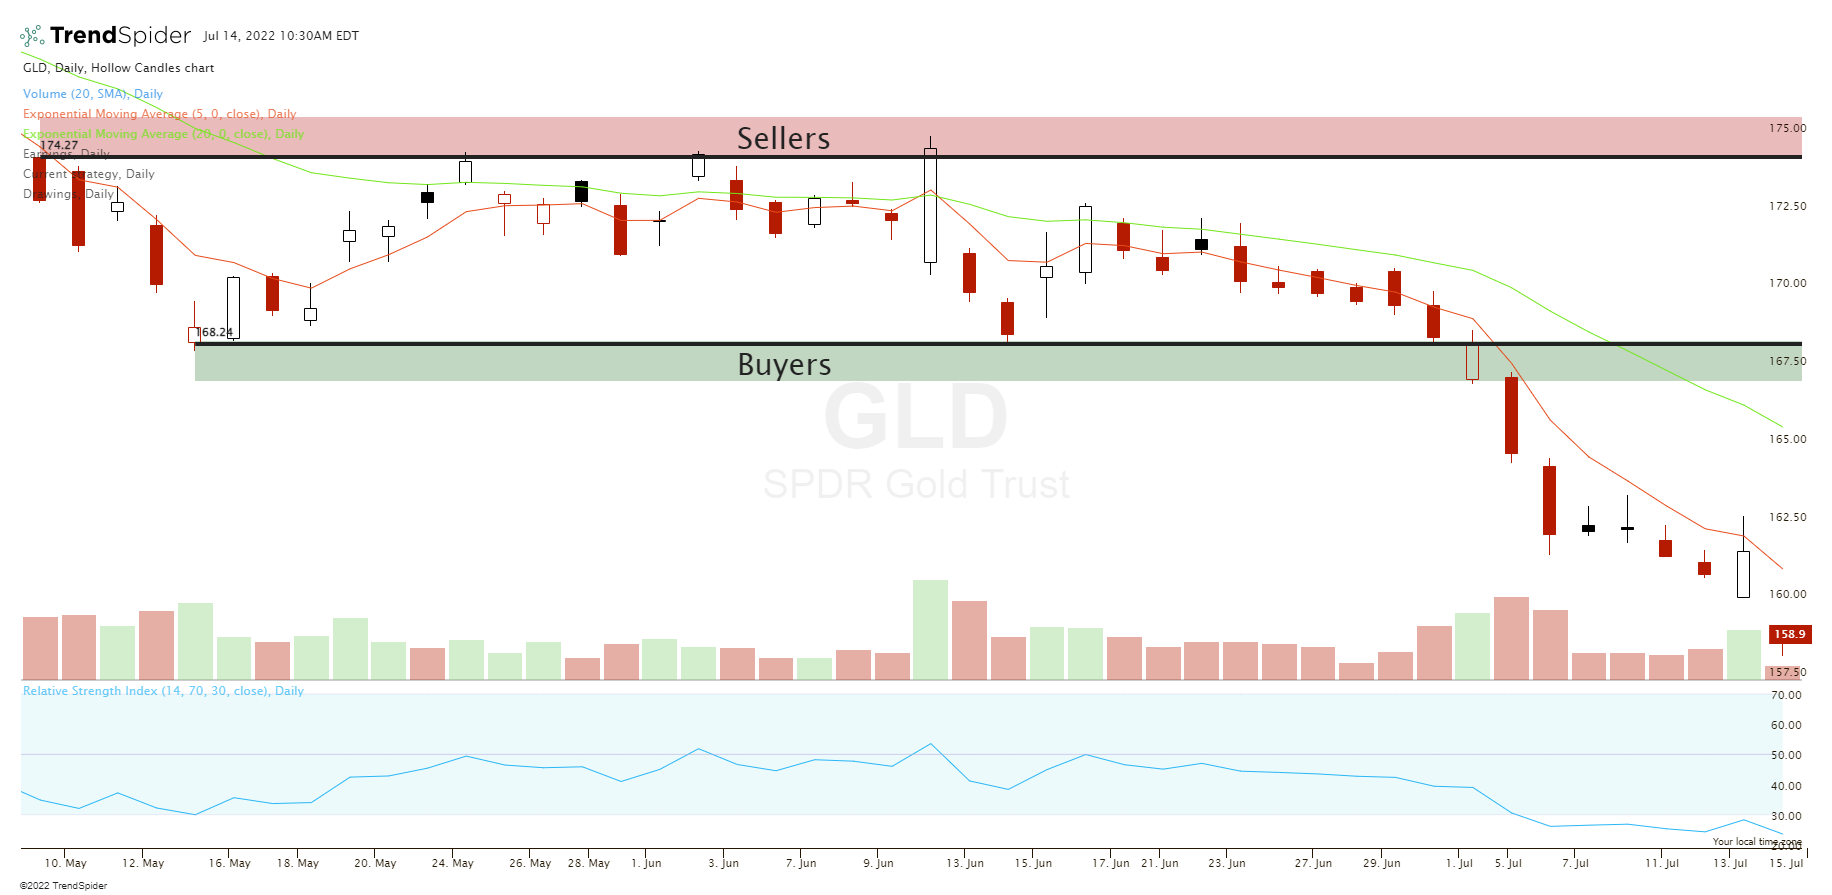
In technical analysis, support is the price level on a chart that is quantified with a horizontal or vertical trendline that identifies the high probability location where buyers are located based on previous behavior. This is generally a reoccurring price zone of buying. This is where buyers are accumulating a position.
Resistance
Resistance is the price level on a chart that is quantified with a horizontal or vertical trend line that identifies the high probability location where sellers are located based on previous behavior. This is generally a reoccurring price zone of selling. This is where sellers are distributing a position.
Break out
Breakouts can be entry signals based on price breaking and closing above or below a declining trendline, ascending trendline, horizontal trend line, or a close above previous price range resistance or below support. A breakout is a momentum signal showing a range expansion in one direction. This can be meaningful for trend followers and momentum traders.
Chart patterns
Chart patterns are simply a visual representation of the prices buyers and sellers bought and sold at in the past that created ranges, swings, and trends. There is no magic in a chart pattern they just show you what happened in the past and what has a higher probability of happening in the future based on the current directional bias in the market. The best use of chart patterns is to take a wider view of the trend on your time frame of choice and follow the path of least resistance.

A chart pattern can show that price action is in a range with defined resistance and support. A chart could also show an uptrend of higher highs and higher lows or a downtrend of lower highs and lower lows. Stock chart patterns signal whether a stock is under accumulation or distribution or just trading in a defined price range.
The most popular use of chart patterns is for breakout trading signals as the probability increases of a sustained move in one direction after a price breakout of a previous support or resistance zone occurs. Chart patterns are basically momentum indicators on a breakout of a trendline. The value of the pattern signal comes from creating good risk/reward ratios by cutting a loss short when the trade doesn’t work out, but letting a winning trade run when it does trend in your favor.
Chart patterns can be bullish, bearish, or show a price reversal depending on the direction of the momentum of the current move. They can also be used as risk management tools showing where to set stop losses if a breakout fails or set profit targets for a continuation. Chart patterns can filter price action for the current market’s bias in movement.
A chart pattern is a visual tool for seeing which direction a market is currently moving in by the pattern the buyers and sellers are making. The investors that dismiss chart patterns and believe they don’t work show they don’t understand their true use as what creates profitable trading is favorable asymmetric bets, not winning every time. Profitability comes from profits being more than losses over the long term not predictive ability or perfection in pattern playing out as expected. Chart patterns are tools for reading price action not a holy grail of trading.
Candlestick patterns
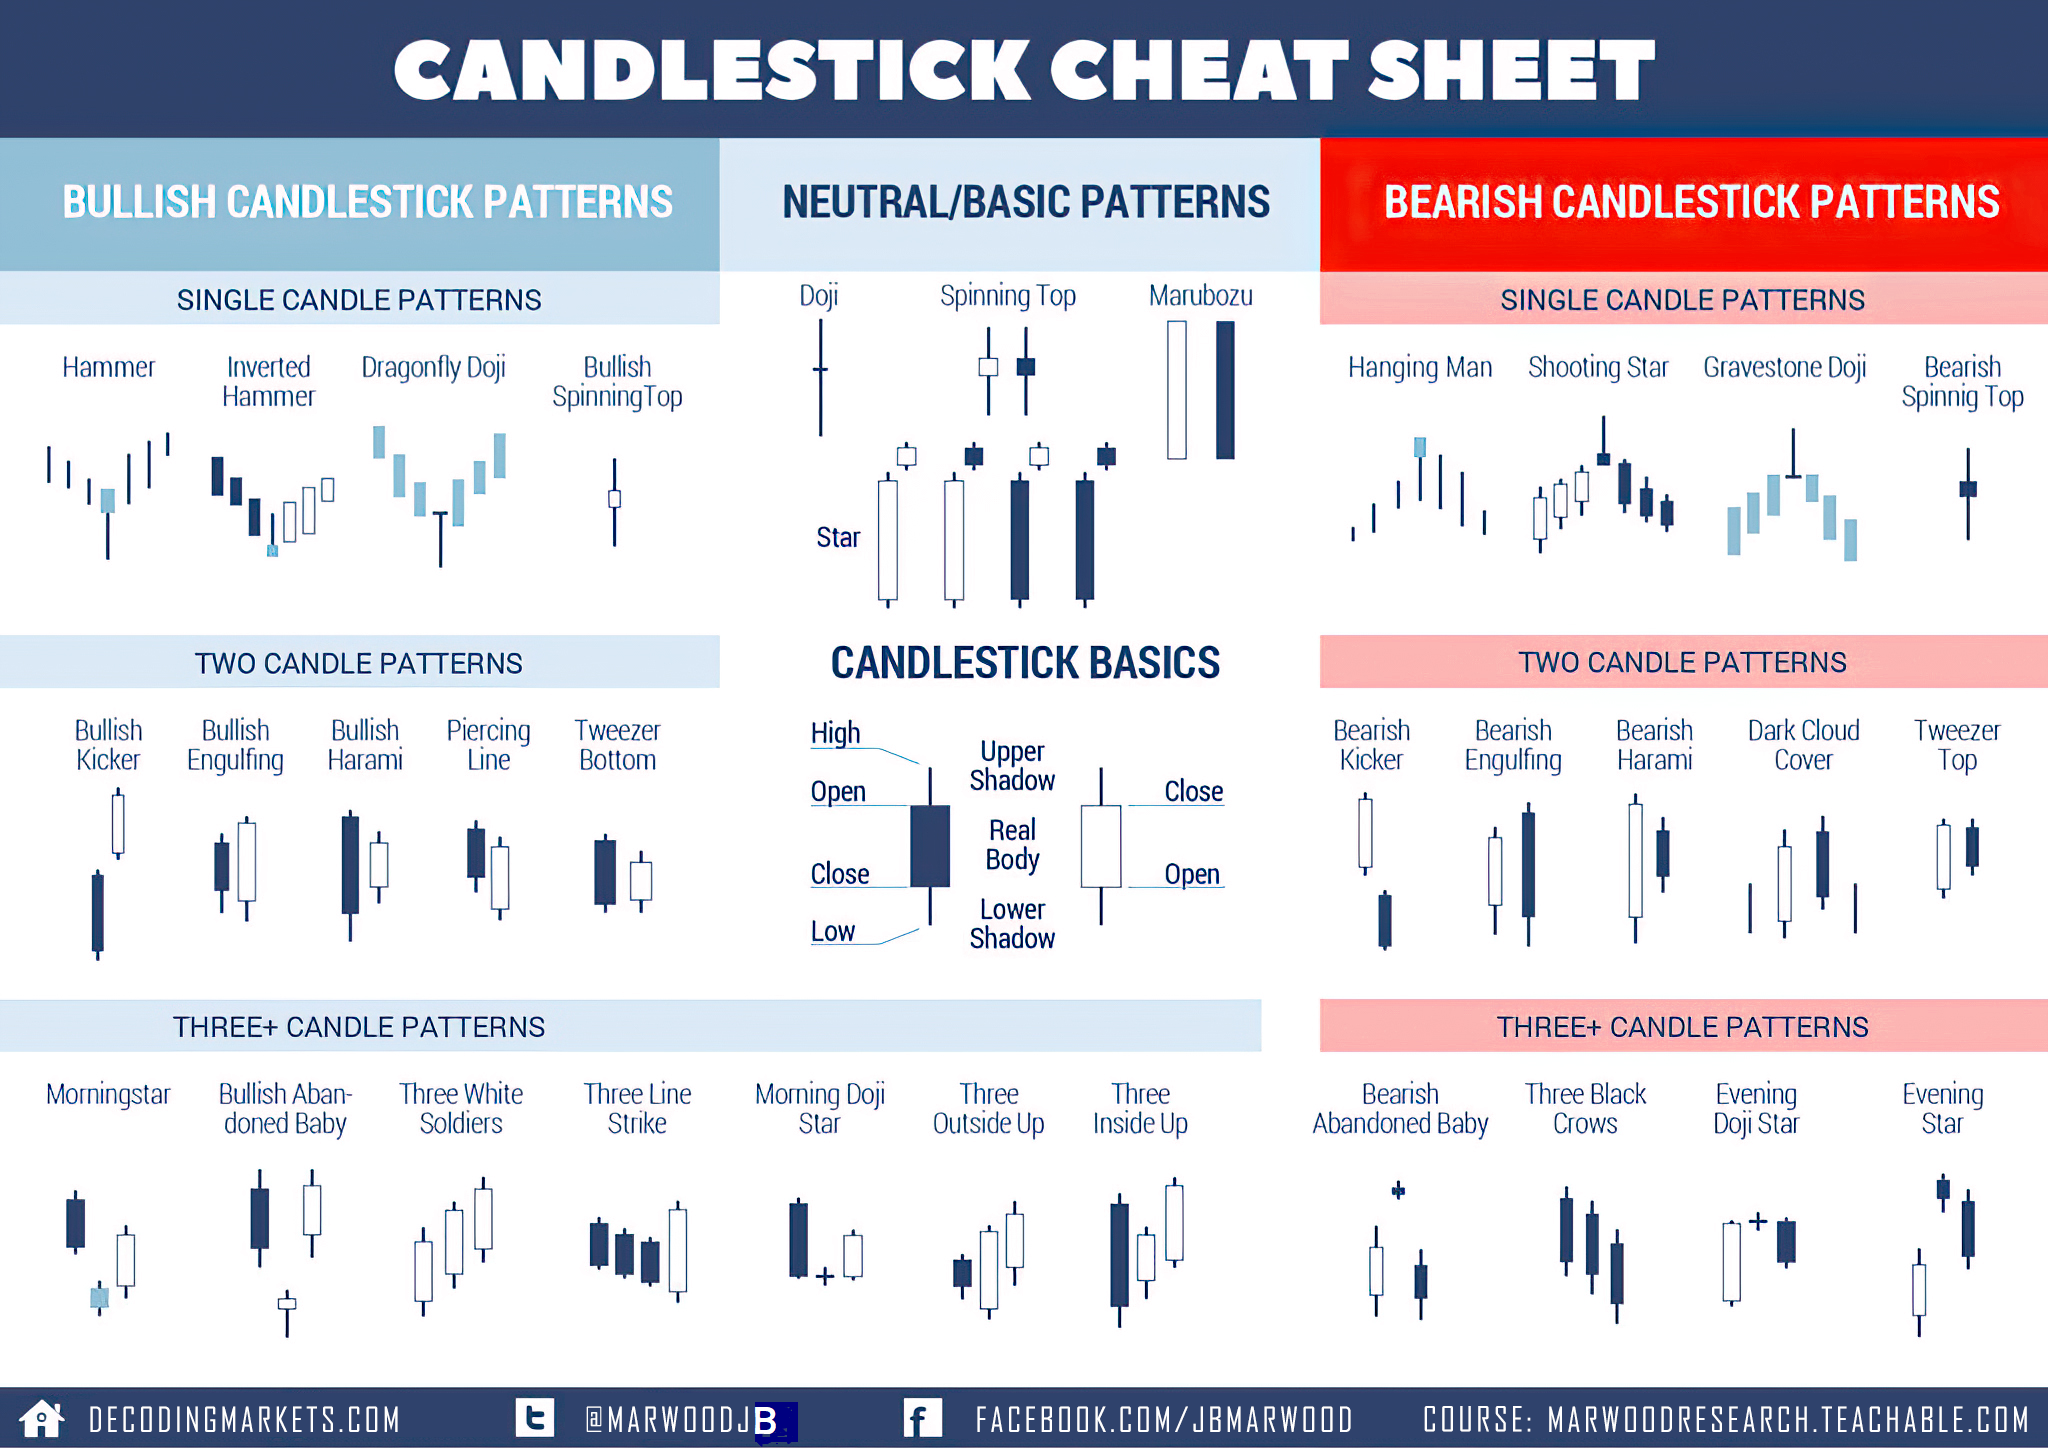
A candlestick is a type of chart used in trading as a visual representation of past and current price action in specified timeframes. A candlestick consists of the body with an upper or lower wick or shadow. Candlesticks are created using the opening and closing prices along with the trading range of the candlestick period. You can read my past article here for a deeper dive.
Candlesticks can combine together to create patterns that define the beginning of swings, trends, or reversals based on rejections at key levels on a chart in price action. Candlesticks can create their own smaller micro patterns inside the bigger context of the larger macro chart patterns.
Trading analysis
Technical analysis is a tool for understanding the right levels on a chart to manage each trade with these five things:
Entry signal: Your trade entry must be based on a quantified signal that will put the odds in your favor of the price moving in a favorable direction to make you profitable based on its location, momentum, and meaning inside the context of the chart.
Stop loss level: You must decide on the level that price shouldn’t go if the trade is going to work out in your favor. The stop loss is the price level where you will accept that your trade is not going to work out and you’re going to exit with a small loss. This is the part of your trading plan that eliminates the possibility of large losses.
Position size parameters: Based on the volatility of what you’re trading and the placement of your stop loss you must decide what percentage of your total trading capital you will use for your trade. You must consider how much you will lose if your stop loss is hit.
Trailing stop loss level: In winning trades you must choose a trailing stop with price action, a trendline, or a moving average that you will lock in profits if your winning trade reverses to that price level. This is the way to maximize a winning trade by not exiting until you have a reason to and having a trading plan to lock in remaining paper profits while they are still there.
Profit target level: This is a predetermined price level on the chart where you will lock in profits if your trade gets to a specific technical level. This is a way to minimize giving back paper profits when you are satisfied with a large enough profit. This is the maximum level you where expecting to reach and likely the optimal level to take your full profits while they are still there.
Trader’s success is based on how trades are managed and the best way to manage them is by using technical analysis. How emotions are managed to maximize wins and minimize losses by admitting quickly when proven wrong about a trade is the trading psychology that must be combined with technical analysis to become profitable.
The perfect graphic analysis guide from beginner to advanced
