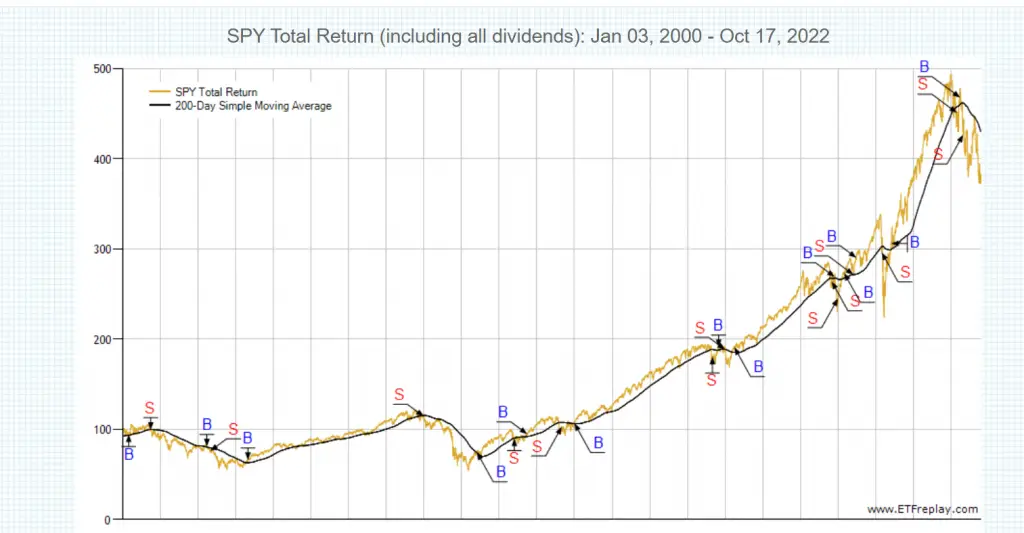
Buy and hold investing is the strategy of buying a diversified portfolio of stocks using mutual funds or ETFs and holding them for the long-term. The normal hold time for buy and hold can be from 30 to 40 years. The strategy uses the historical returns for the U.S. stock market as its backtest.
The S&P 500 index acts as the primary benchmark for the performance of the U.S. stock market, dating back to the 1920s and in its modern formula, to the 1950s. The index has returned a historic annualized average return of around 11.88% since its 1957 inception through the end of 2021. [1]
The long term buy and hold investing strategy smooths out bear market losses through the average return of bull market gains over long periods of time. The higher the holding time frame the greater the odds of profitable investing, with 20, 30, and 40-year holding periods returns are historically very good.
Buy and hold investors get rewarded for risk exposure through all market environments. Warren Buffett says buying and holding the S&P 500 index is the right investing strategy for the majority of people that have no interest in investing. Buying and holding the S&P 500 using a low cost mutual fund or the SPY ETF is the gold standard of simple investing. Now, what if there was a way to beat this strategy with a simple moving average and end of month signal?
What does a 200 day moving average mean?
The 200-day moving average is one of the most popular indicators used in technical analysis. It’s used in classic charting to define uptrends and downtrends on charts. It is simply the average of the previous 200 days of closing prices. It’s calculated by adding up the previous 200 days of closing prices on a chart and dividing by 200. It comes as a default setting on many chart platforms and is calculated for you on the chart.
The 200-day moving average ascending higher is a signal the chart is in an uptrend while a 200-day moving average descending lower is a downtrend signal. In technical analysis it’s bullish when price is above the 200-day moving average and bearish when price is below it.
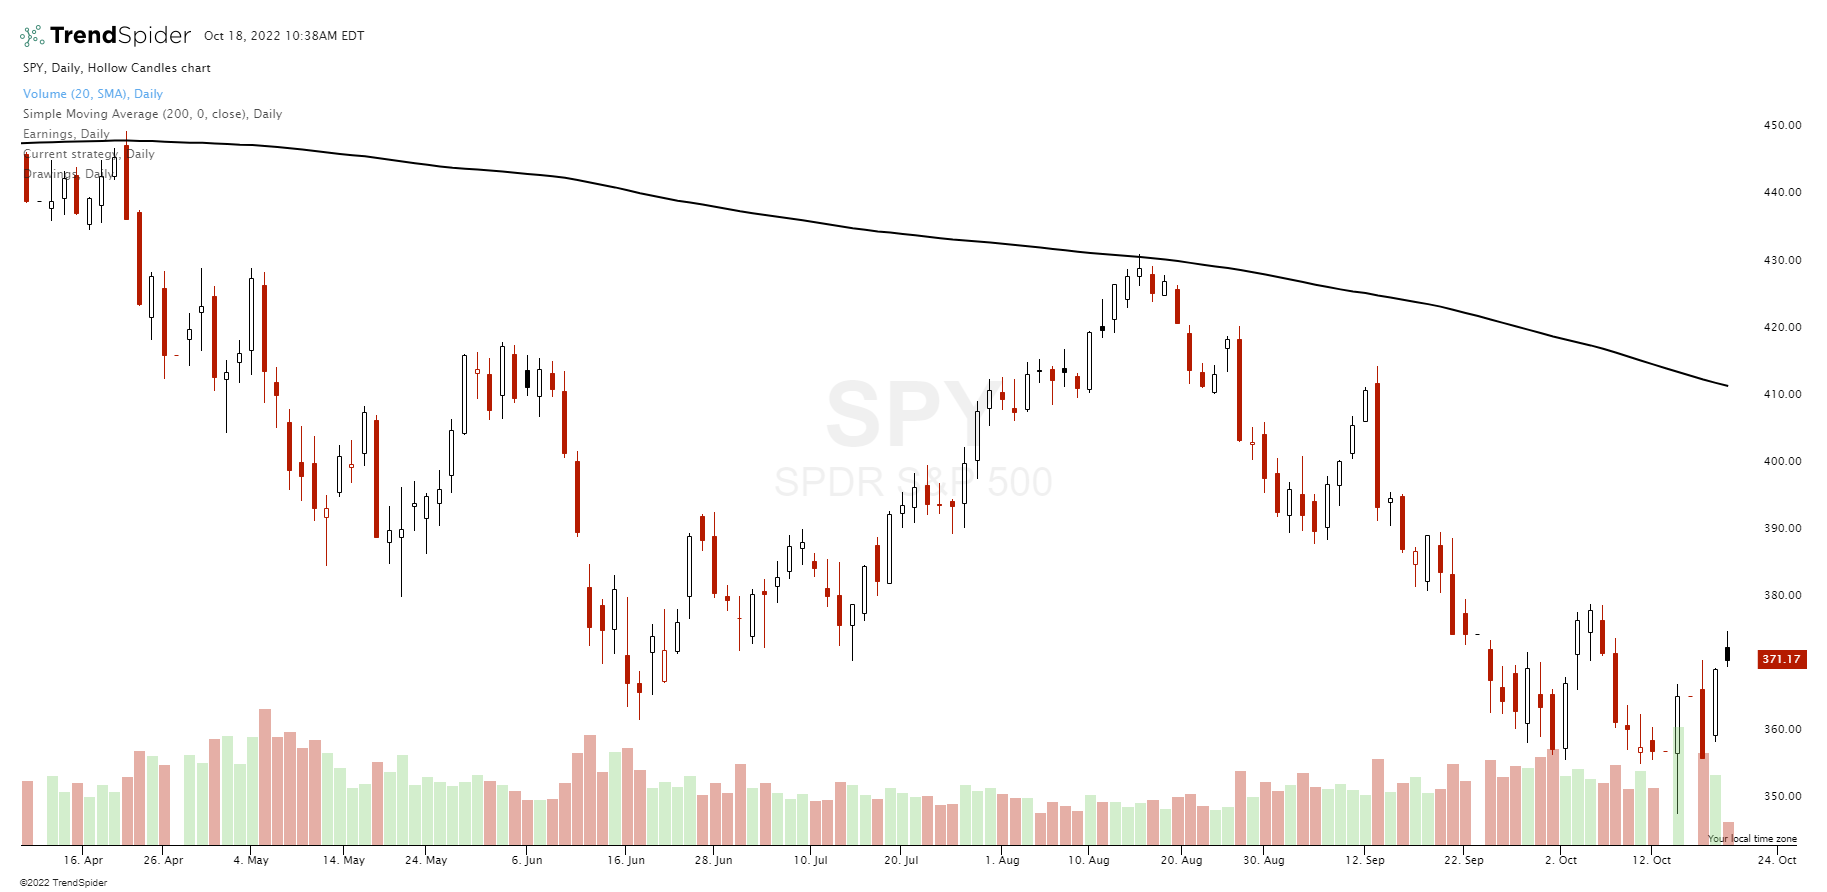
Why is the 200 day moving average important?
“My metric for everything I look at is the 200-day moving average of closing prices. I’ve seen too many things go to zero, stocks and commodities. The whole trick in investing is: “How do I keep from losing everything?” If you use the 200-day moving average rule, then you get out. You play defense, and you get out.” – Paul Tudor Jones
The 200-day moving average can be used as a trend following signal to indicate it’s the right time to be long and have risk on in a bull market. It can make you money by telling you when to stay in and ride the long-term trend higher. The 200-day moving average can also be a risk management tool to signal when it is time to lock in profits and go to cash as a new bear market begins.
The major value in the 200-day moving average as a signal is to help you avoid the big drawdowns in bear markets and market crashes and let you start the next bull market run up with a higher amount of capital for better compounding of returns. The 200-day moving average signals when to get back in as an early bull market may be trying to emerge as price breaks out over this line
Buy and hold vs trading
The downside of buy and hold investing is the pain that has to be endured during bear market drawdowns and market crashes, finding a way to decrease the drawdowns in capital could also help increase the returns. With buy and hold investing when you buy and how you accumulate your position over time and when you need the money in retirement and must sell affects your returns. All investing strategies have an element of timing. The 200-day moving average helps with this timing aspect of investing.
The 200-day moving average as a stand alone indicator one the daily chart can give a lot of false signals if price action is volatile around this line. One way to adapt for this noise and also make it more like a variation of a buy and hold investors time frame is to wait for the end of month final signal. Let the price action close on the last trading day of the month be your final indicator to take action.
This is nearly a passive strategy where you watch for price to close back above or below this line at the end of the month. If prices stays over the 200-day or stays below the 200-day all month there is nothing to do. This single indicator will keep you long through the majority of bull markets and in cash for the majority of bear markets with some lag time getting out and getting back in.
Here is this 200-day simple moving average strategy that beats buy and hold investing over the past 22 years using the principles of trend following.
On the last day of each month you take one of the actions:
- On the last trading day of the month if you are long the SPY ETF and price is going to close over the 200-day simple moving average you stay long.
- On the last trading day of the month if you are long the SPY ETF and price is going to close under the 200-day simple moving average you sell your position and go to cash.
- On the last trading day of the month if you are in a cash position and price is going to close over the 200-day simple moving average you buy the SPY ETF and go long.
- On the last trading day of the month if you in a cash position and price is going to close under the 200-day simple moving average you stay in cash.
It’s not complex and only takes one action on the last trading day of the month for buy and sell signals. It historically beats the returns in holding the S&P 500 index by 238% and cuts the drawdown of capital almost by one third. This is an incredibly better risk adjusted return versus buy and hold investing alone in the S&P 500 index.
Below is the backtested data of this strategy going back to the year 2000 through bear markets, bull markets, bubbles, and crashes.

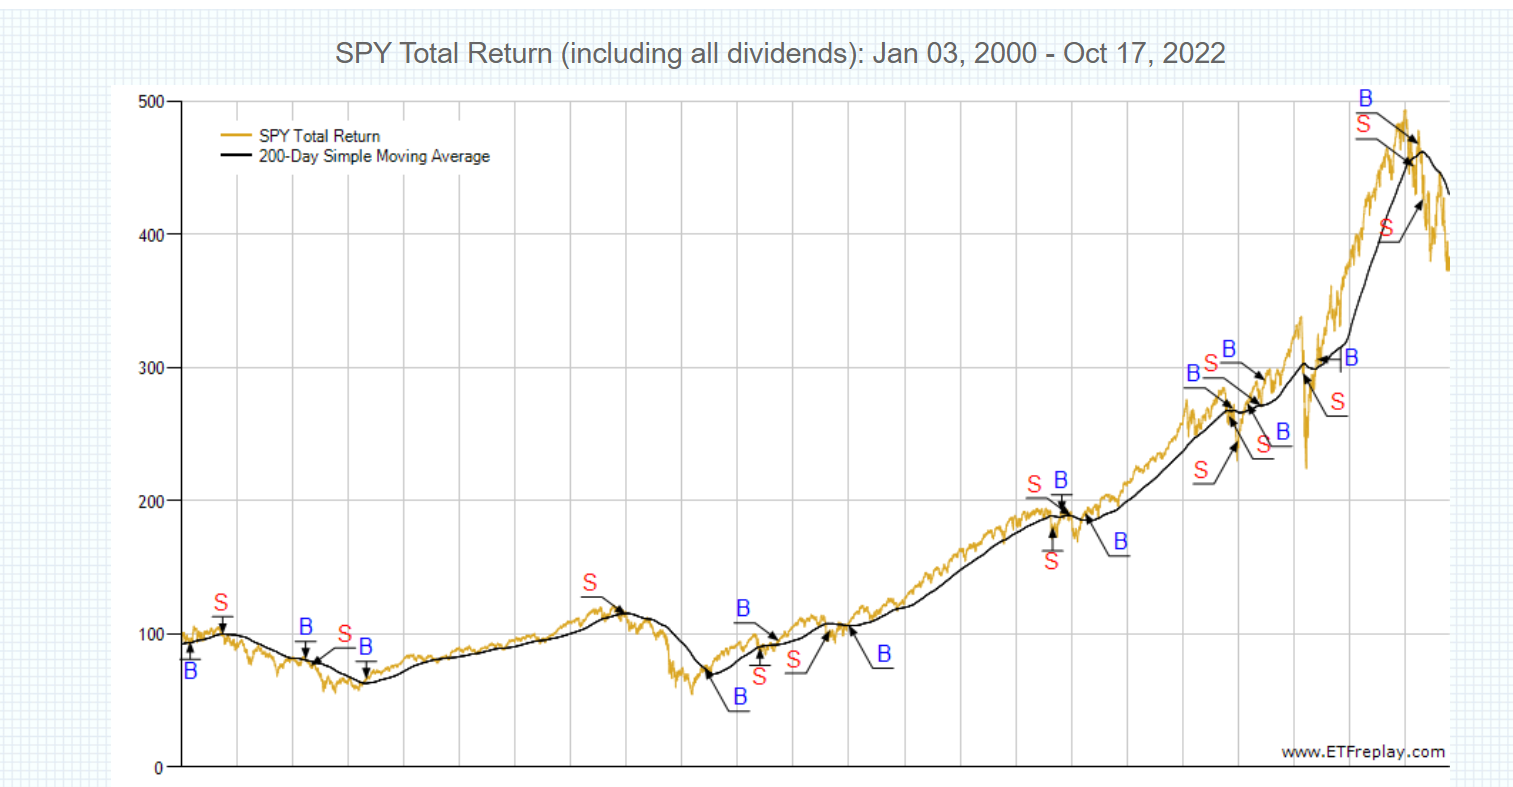
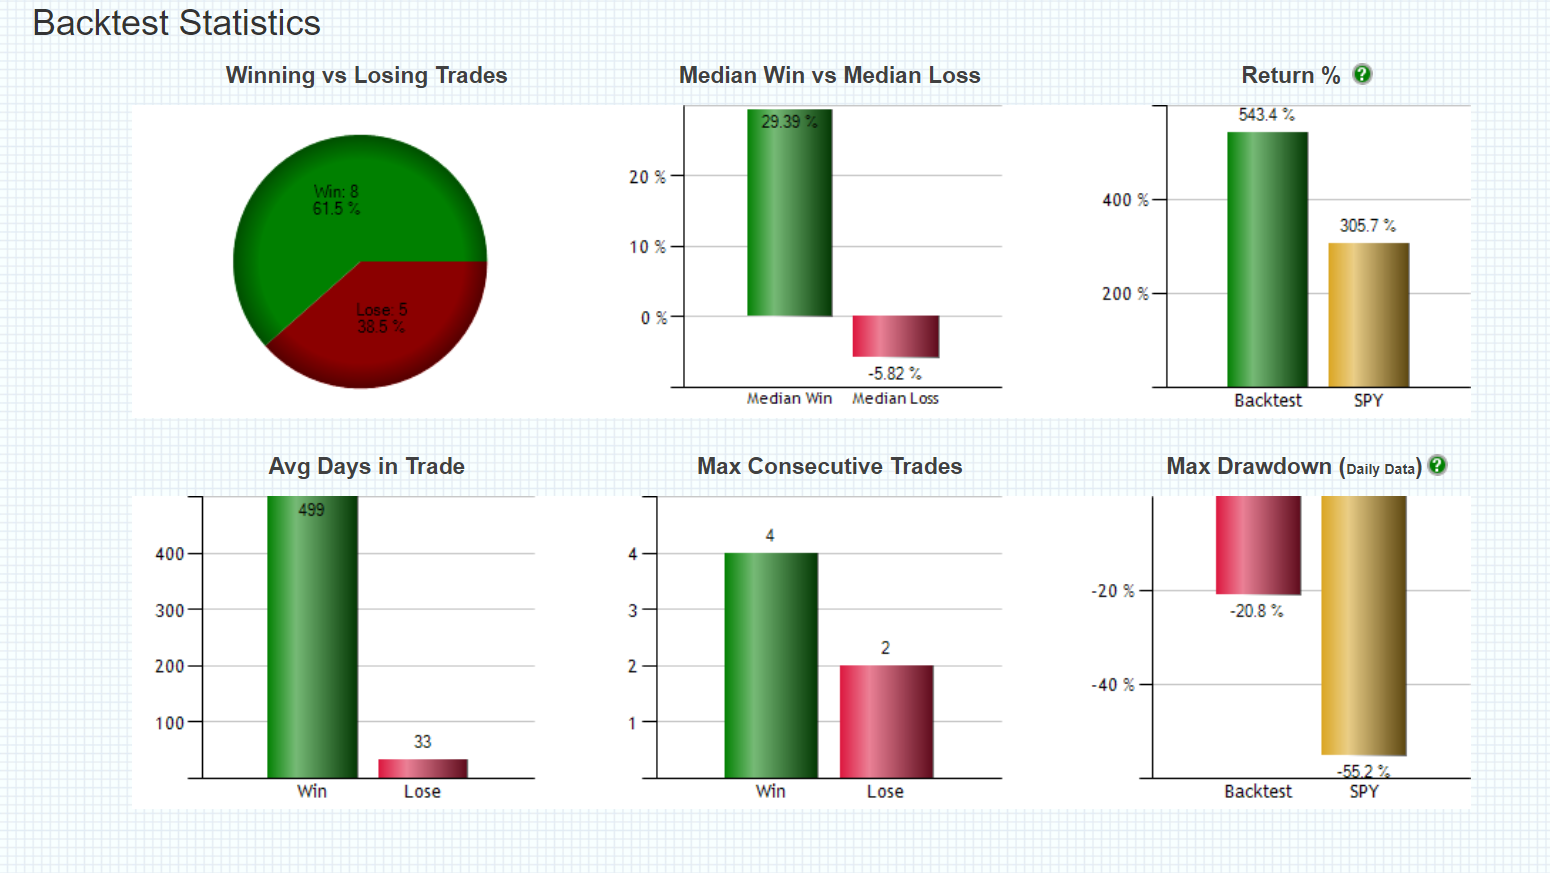
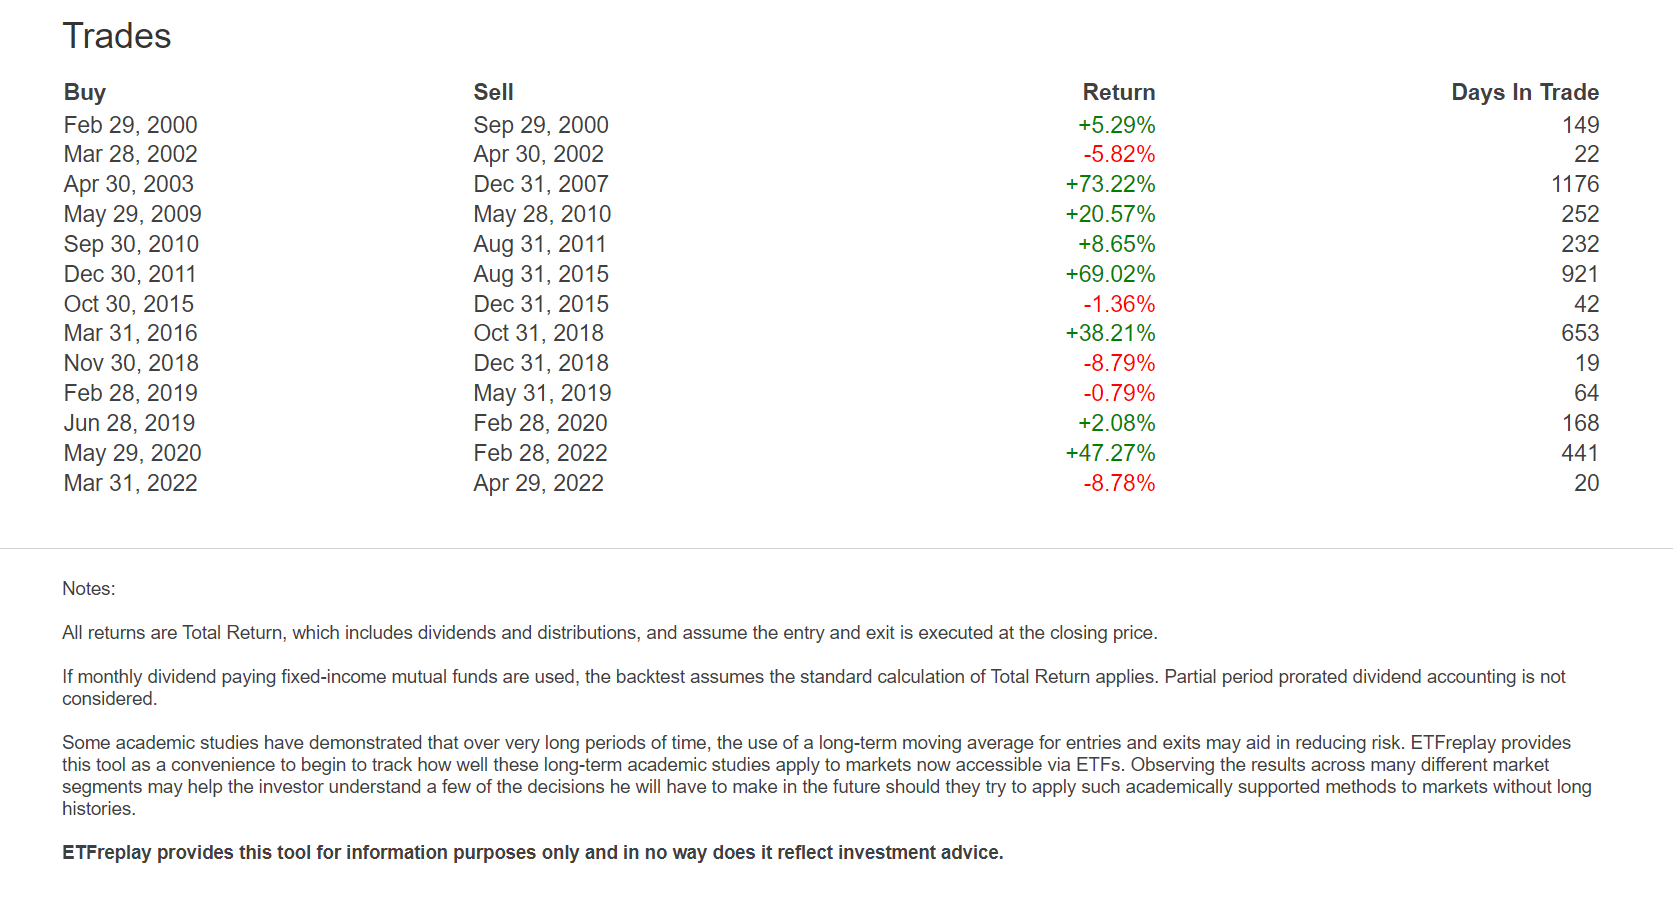
The trading signals for this system had 13 entries and 13 exits and is currently in cash as of the day of the backtest data. The signals avoided all four of the major bear markets of the past 22 years and outperformed SPY ETF returns by nearly double.
A great example of the principles of trend following in action.
