This is a guest post by Leo Smigel the Founder of AnalyzingAlpha.com.
If you’re like most traders, you’re always on the lookout for new trading patterns to add to your arsenal. After all, the more trading patterns you know about, the more opportunities you have to make money in the markets.
In this blog post, we move away from candlestick patterns and discuss five little-known trading patterns that can be highly profitable. So if you’re ready to learn some new strategies, read on!
1. The RSI SuperStack Pattern
The RSI SuperStack pattern is a trading strategy that uses the Relative Strength Index (RSI) indicator to identify overbought and oversold conditions in the market. This pattern can be used to generate profitable buy and sell signals.
It’s just like the standard RSI, but with one catch.
The SuperStack triggers when all the significant timeframes below the selected stack level have reached their trigger conditions.
The major timeframes are the following:
- Monthly
- Daily
- 4-Hour
- 1-Hour
- 15-Minute
- 5-Minute
- 1-Minute
For example, a SuperStack on the 4-hour timeframe will have RSI in oversold conditions on the 4-hour, 1-hour, 15-minute, 5-minute, and 1-minute timeframe.
You can learn more about the SuperStack from the ChartGuys video below. If you’re an algorithmic trader, you can check out a live example on GitHub.
2. The Episodic Pivot
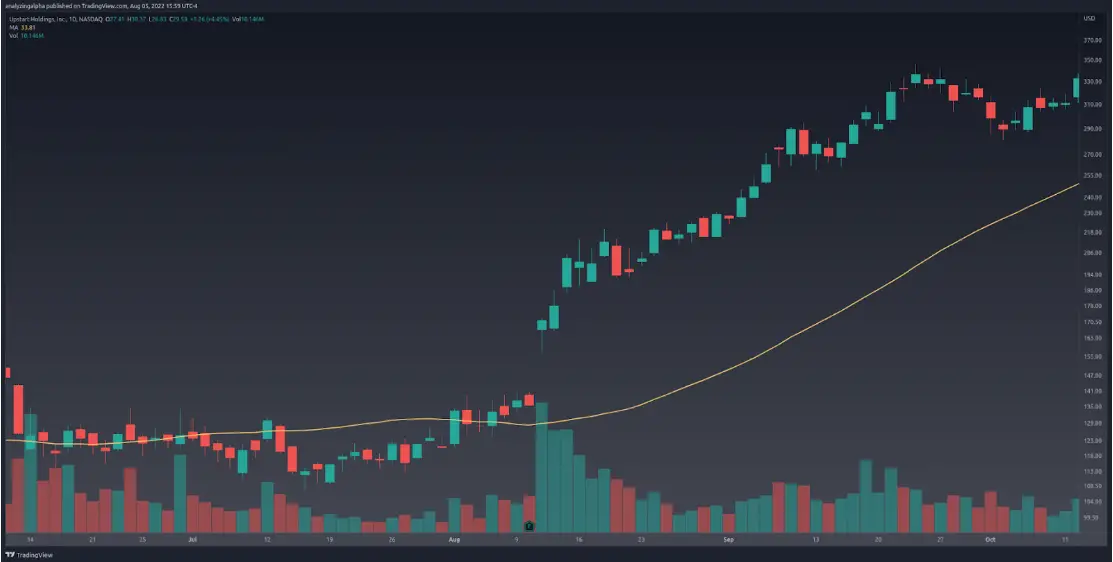
Price tells a story. And when a stagnant stock is turning over a leaf, you want to pay attention. The great news is that it works in all markets, and there’s considerable academic research behind this one.

The critical understanding is that institutions move the market. Remember how I’ve said to follow the They value or price stocks and then buy them in bulk at some margin of safety below their estimated intrinsic price. When new earnings or forecast information is released, typically at the quarterly earnings announcements, these institutions often have to revalue the company and have to buy or sell in bulk to get to their desired allocation.
All we need to do as a retail investor is identify this buying and ride on big money’s coattails.
So what does this pattern look like? Simple. A massive gap up in premarket, usually 10% or more, with trading its average daily volume within the first 20 minutes.
You can read more about the post-earnings drift anomaly and the episodic pivot at Analyzing Alpha.
3. The Slingshot
Ever wanted to get into powerful stocks right after a pullback, just as the downward momentum beings to wane and the stock begins the initial leg of its explosive move up?
This is what Scot1land did, and it’s one of his bread-and-butter trades he used to generate multiple 302% annual returns.
The critical insight is that strong stocks tend to buck the trend first.
The Slingshot indicator is a cross of price above the high of the 5-EMA of whatever period you’re analyzing. But that’s not all you need; you’ll also want:
- A pullback in a strong stock
- A range break
- Consolidation (to get more favorable risk-ward terms)
If you use TradingView, you can use the @taplot slingshot indicator.
4. The Price Shear
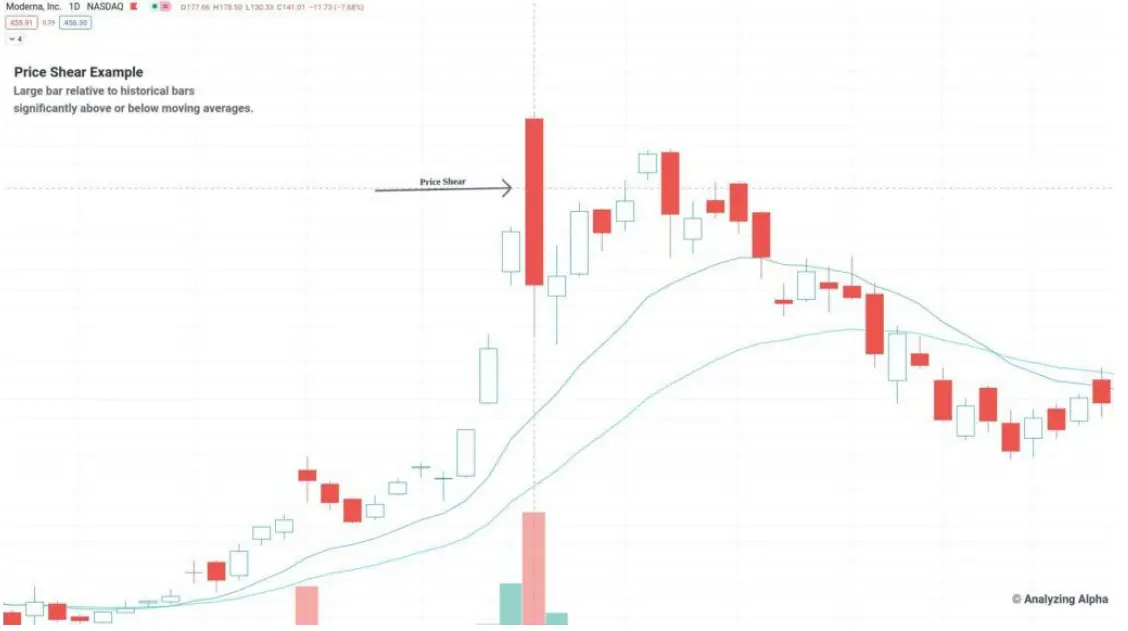
A price shear is simply an excessive move to the upside or downside relative to historical bars on no news. We expect the traders and algos to capture some of this profit, causing mean reversion.
The price shear trading strategy is a simple but effective approach that can take advantage of excessive market moves. This strategy involves buying or selling when the price of a security moves beyond a certain threshold relative to historical prices.

For example, suppose you are watching a stock trending higher for the past few days. If the stock suddenly makes a significant move up or down, it may be indicative of a price shear and provide an opportunity to trade accordingly.
The price shear trading strategy can be implemented using various technical indicators such as the Relative Strength Index (RSI) or the Moving Average Convergence/Divergence (MACD). It is also important to wait for confirmation of the move before taking any action.
5. Follow The Leader
A follow-the-leader trading strategy is a play on a quantitative arbitrage approach that takes advantage of price discrepancies between two related securities. This strategy involves buying or selling the security that is lagging behind the other related security.
For example, suppose you are watching the gold market, and you notice that the Gold Miners ETF (GDX) makes an oversold move setting a higher low. You can then quickly execute a buy on GLD, anticipating a following.
In other words, you’re using one asset’s support, resistance, and trend to trade a related asset.
You can use any of the above trading strategies and pair it with a follow-the-leader strategy to increase your win rate.
