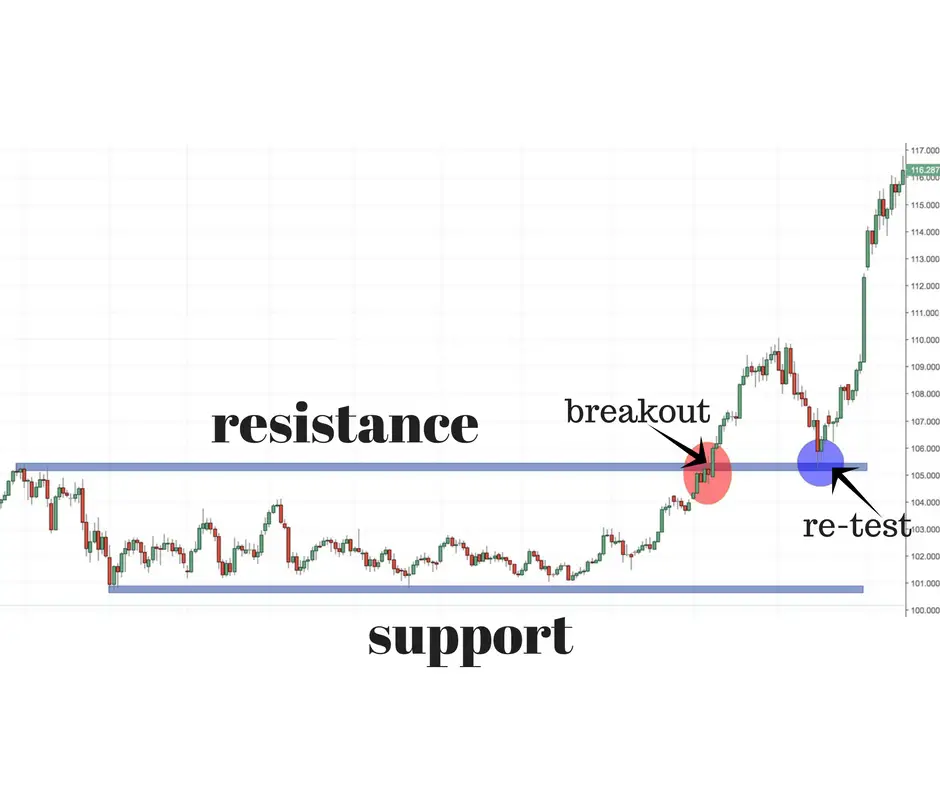
In technical analysis, support is the price level on a chart that is quantified with a horizontal trend line that identifies the high probability location where buyers are located based on previous behavior.
Resistance is the price level on a chart that is quantified with a horizontal trend line that identifies the high probability location where sellers are located based on previous behavior.
Be aware that the trend lines identify zones of support and resistance more than exact prices.
Types of Support and Resistance
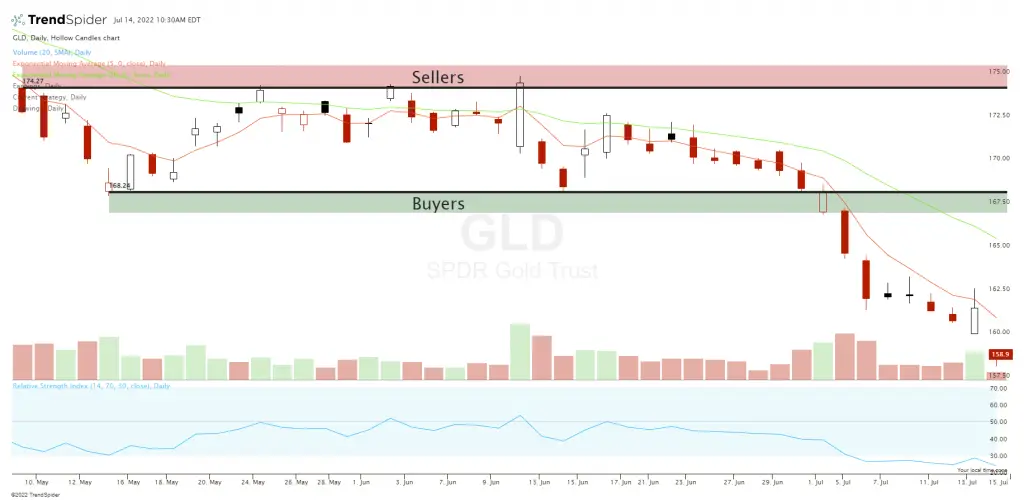
Charts can have either lower horizontal support during a trading range or ascending vertical support during an uptrend in price.
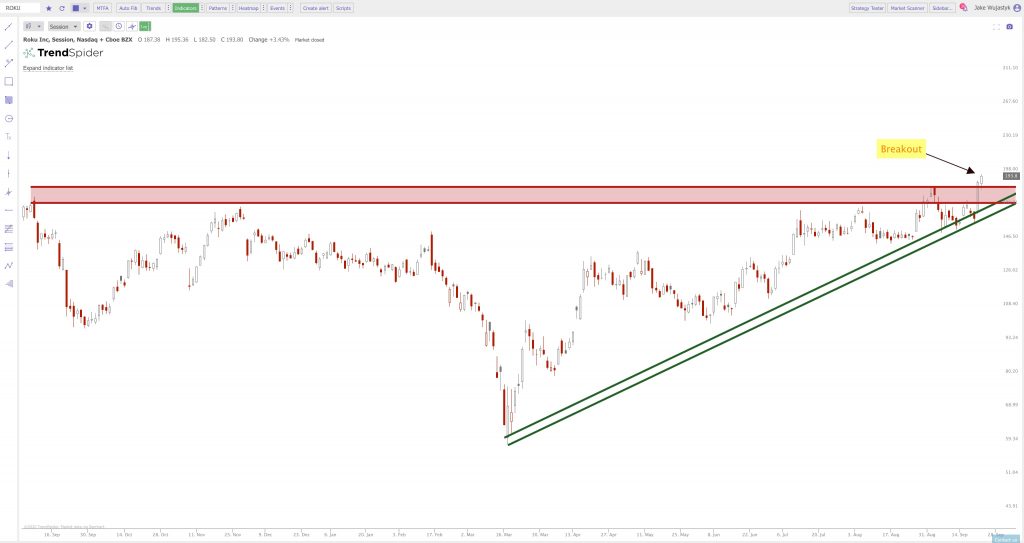
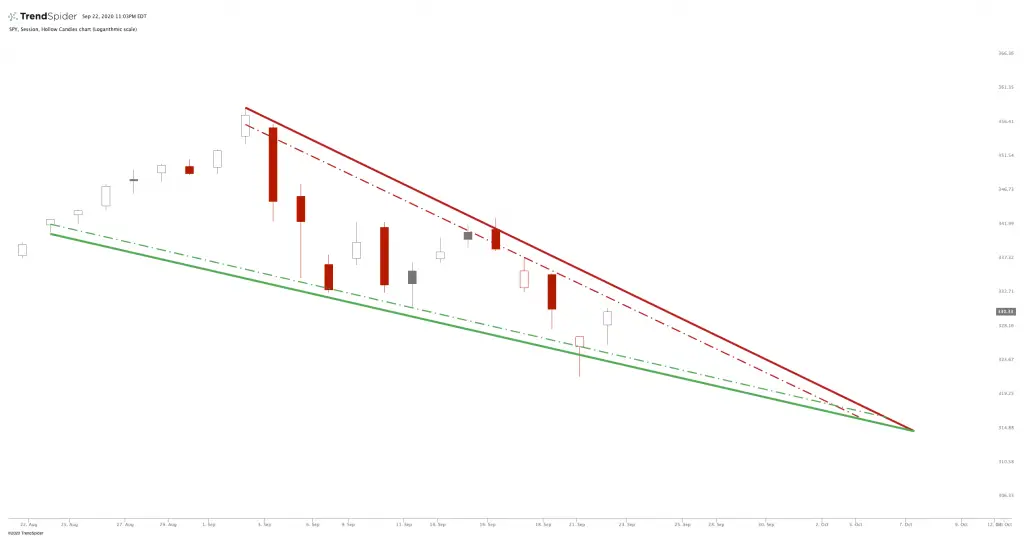
Charts can have either upper horizontal resistance during a trading range or vertical descending resistance during a downtrend in price.
Charts courtesy of TrendSpider and Jake Wujastyk
Uptrends have support with higher lows and downtrends have resistance with lower highs.
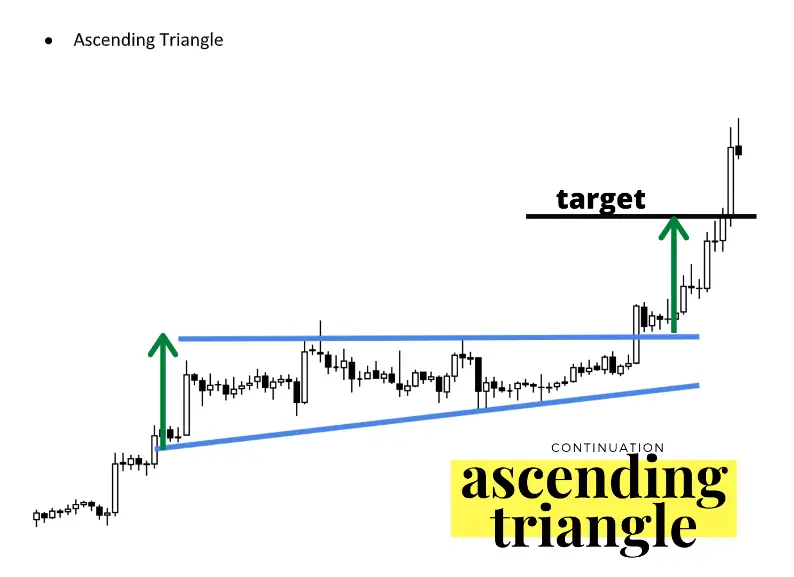
Horizontal resistance plus ascending vertical support creates a bullish ascending triangle pattern.
Horizontal support plus descending vertical resistance creates a bearish descending triangle pattern.
Higher lows shows buying pressure on a chart as it fails to go lower on each sell off attempt.
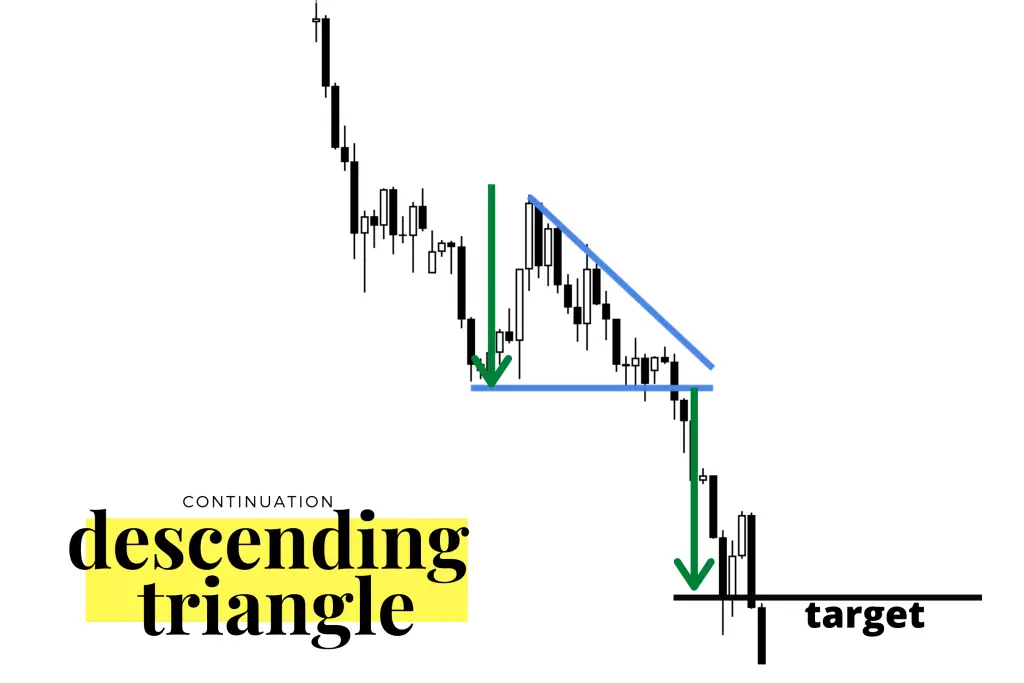
Lower lows shows selling pressure on a chart as it fails to go higher on each rally attempt.
Support and Resistance Trading
During long-term price ranges in sideways markets traders should be thinking buy support and sell resistance.
When a strong breakdown occurs below support, traders can start looking at the probability of a new downtrend or downswing emerging so they can start considering short selling.
When a strong breakout occurs above resistance traders can start looking at the probability of a new uptrend or upswing emerging so they can start considering buying the breakout.
Many times the first breakout of a range will swing in that direction for several candles before returning to the breakout area one time before resuming the trend in the direction of the original breakout. This gives traders that missed the breakout a second chance to enter the move.
Gaps in price that don’t close in the first hour of trading tend to move in the direction of the gap for the remainder of the day.
Fear of missing out (FOMO) can kick in as a breakout continues its move and cause other traders to pile into the trade helping the move.
What are the rules about support and resistance?
Buying support that is reached on a chart by preceding lower highs has a low probability of success, with these dynamics the odds are greater for a breakdown in price lower.
Selling short a resistance area that is reached on a chart by preceding higher lows has a low probability of success, with these dynamics the odds are greater for a breakdown in price higher.
The more times price returns to the same level of support or resistance the greater the odds of a breakout of that trend line.
The farther away longer term resistance or support are away from a breakout level on a chart the greater the odds price will move until it gets to that old consolidation zone.
Breakouts can gain momentum and trend as range traders are forced to cover short positions above resistance and long side traders are stopped out under support for a loss.
The primary rules of trading support and resistance is to connect the lows and the highs on a chart using trend lines to quantify the path of least resistance and then trade in that direction.
- Buy dips in uptrends.
- Sell rallies in downtrends.
- Trade inside a confirmed range.
- Breakouts signal a potential new trend or trading range.
- Buy breakouts.
- Sell breakdowns.
If you’re interested in trading the price action in the markets you can check out my best selling book Ultimate Guide to Technical Analysis here or my other trading books on Amazon here. I have also created trading eCourses on my NewTraderUniversity.com website here. My educational resources can save you both time and money in your trading journey.
