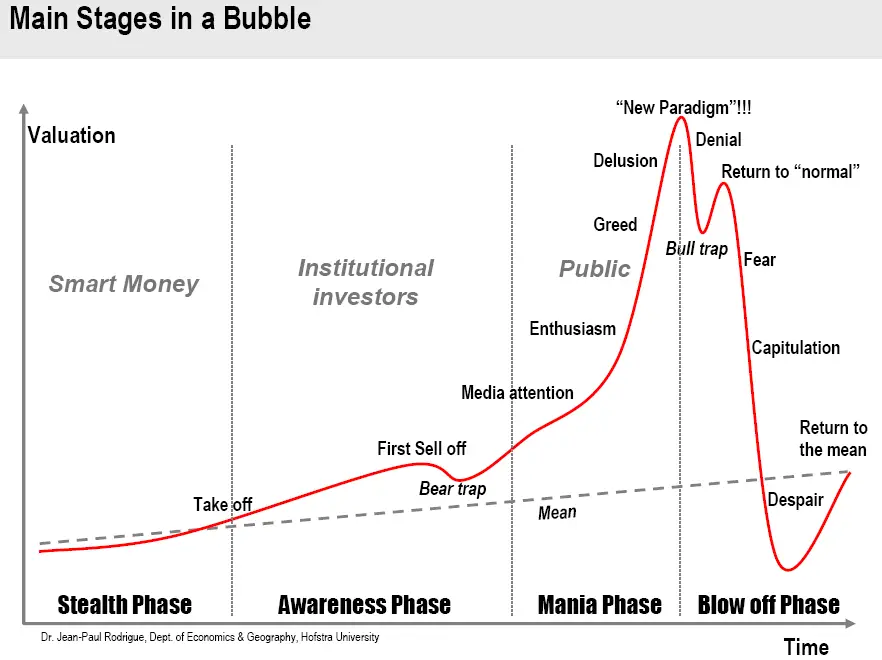
Market Bubble Stages
Market bubbles go through four stages on charts.
Stealth Phase
The early stealth phase happens at the beginning of a new market cycle as it goes sideways and forms a price base. The breakout of this range over resistance is the signal of the potential for the beginning of a new uptrend.
Awareness Phase
As investors and traders become aware of the new uptrend of higher highs and higher lows they will begin to put new capital into the market and drive prices higher. There will be an early correction during this phase as people lock in early profits.
Mania Phase
As the uptrend gets back to new highs and begins to go up faster and with more momentum it attracts media attention with more people buying on the fear of missing out. This phase is where the big money is made as charts can double, triple, or more in a short period of time as the buying pressure is maintained day after day.
Blow Off Phase
On the final surge to highs people start thinking getting in to the market is easy money and that a new technology, new economy, or new business model has changed the market permentantly and it will not go back down. As the market runs out of new buyers at higher prices it puts in a top then reverses as profit taking and trailing stops take over creating momentum to the downside as fear of loss sets in.
The Psychology of a Market Bubble Chart
Take off
The breakout over resistance to new short-term highs in price is not bought by most market participants as they are still thinking sell at the top of the range. However, sellers inside the previous range have been worked through and a new trend is emerging.
First Sell Off: Bear Trap
After the first swing to the upside profit taking will set in leading to an early correction of approximately 10%. The temptation to lock in good profits will be too much for holders.
Media Attention
As the chart returns to highs after the early correction the media will start covering the nice run up in prices letting the majority of people know that a new bull market has begun bringing in new capital chasing gains.
Enthusiasm
The chart continues trending higher on the enthusiasm that the new upswing in price is a real bull market uptrend.
Greed
The appearance of easy money becomes to tempting and people jump in and buy with no understanding of the market and have no exit strategy.
Delusion
The peak in prices in bull markets are reached on the delusion of euphoria as investors start thinking they are geniuses for being long for so long and they start projecting how much money they will make going forward based on previous returns.
New Paradigm
The new paradigm thinking happens when investors believe some new way of doing things with technology has permentantly changed the laws of supply and demand on a chart and it will continue to go higher as the world has changed.
Denial
Investors decide to just stay in the market and hold their positions as they are holding good long-term investments and the chart will return to the old highs in price.
Return to Normal
After charts but in long-term tops, each big rally during the early downtrend will make many investors believe the down move is over and it will return to the previous uptrend and make new highs.
Fear
Investors start to grow fearful and think it may be best to just get out of the market and just save the capital they have left.
Capitulation
The pain of losses overtakes investors plans to hold positions with further lower prices and more people sell to stop the growing daily pain of financial loss.
Despair
Hopelessness sets in near the lows as the majority of investors sell the last positions before all selling pressure is finally relieved as the remaining positions are being held long term.
Return to the Mean
The chart rallies back to a long-term average price like a 200-day moving average and the bottom has finally been put in.
What happens when a market bubble bursts?
When a market bubble bursts, it can create a financial contagion that spreads quickly through all connected assets. They bigger the asset of the chart that goes through the bubble and crash cycle the more widespread the ripple effect in the world financial markets.
A stock market bubble in equites as an asset class is like a big financial hurricane that can sink the ships of all stocks, sectors, and indexes along with other asset classes as investors and traders move into a risk off mode selling everything and raising cash. During corrections in the stock market mutual fund managers will rotate capital from one sector to another and from one type of stocks to another like growth to value. However, as a stock market bubble pops investors can mover their capital out of the stock market by selling mutual fund holdings forcing the manager to sell their positions to raise capital to return to investors.
Market bubbles can overshoot the upside a great deal creating huge speculative price levels with no correlation to present or future value of an underlying asset. The downside after a bubble pops can also overshoot the downside taking an asset far below true intrinsic future value.
Some of the best upside opportunities can happen after the end of a post bubble sell off when a long-term bottom is finally put in.
