How many types of chart patterns are there?
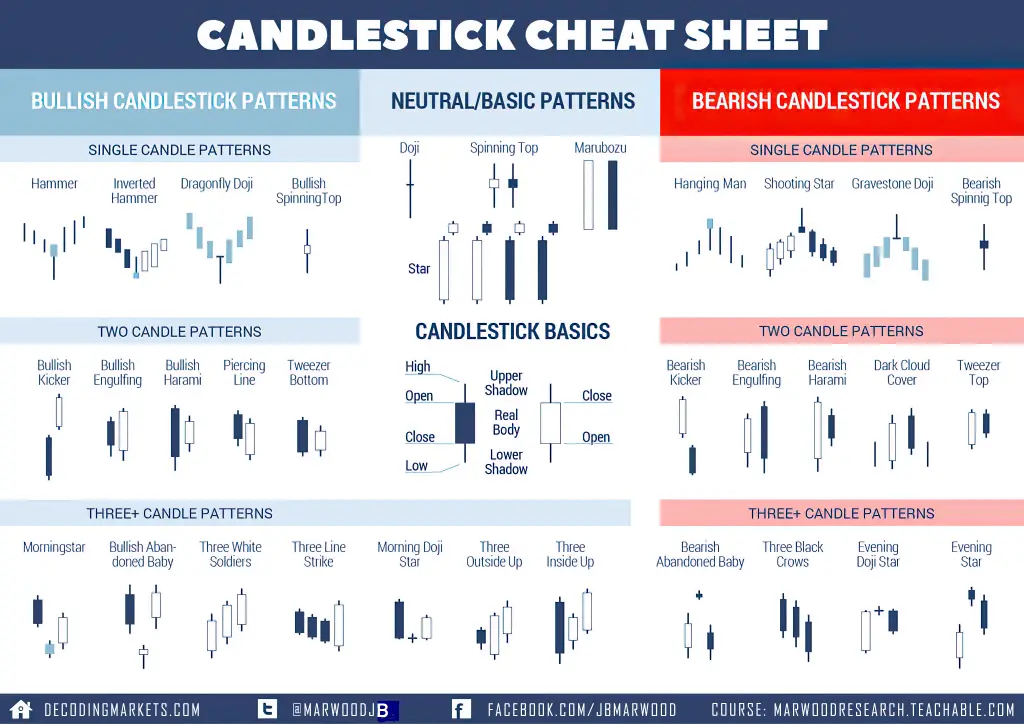
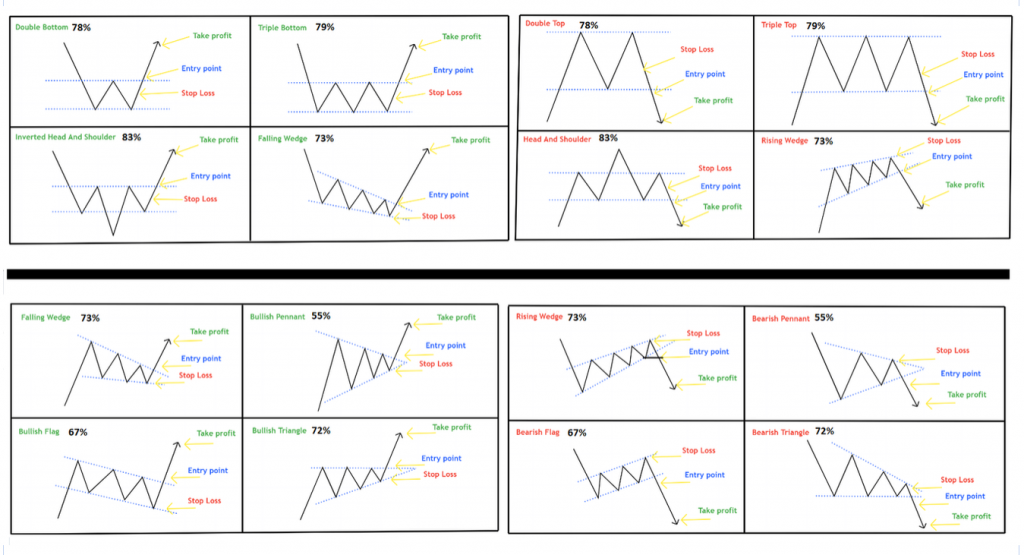
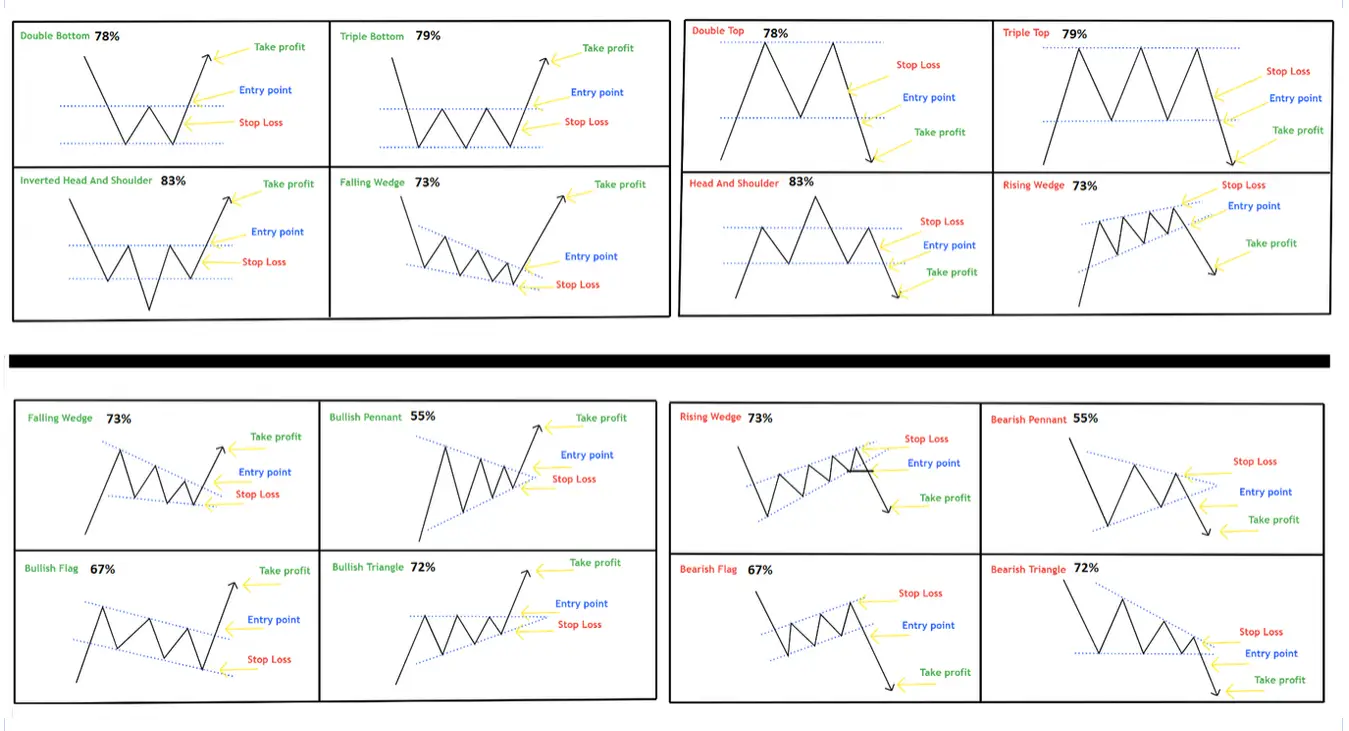
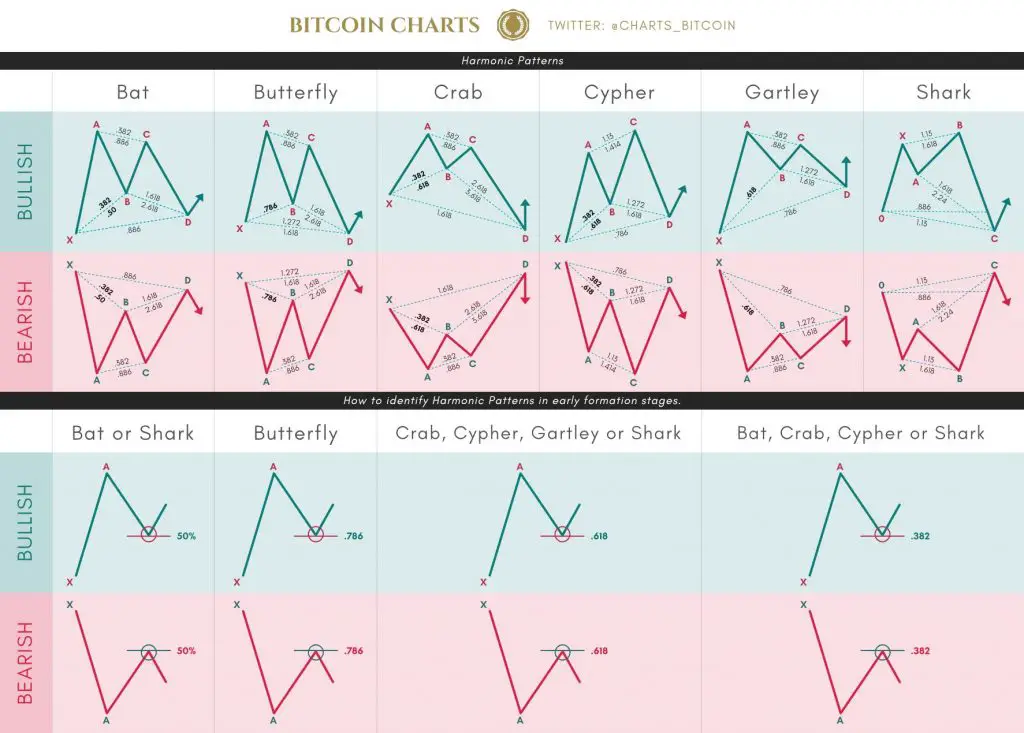
There are three main types of chart patterns which are used in technical analysis: traditional chart patterns, harmonic patterns, and candlestick patterns.
Traditional Chart Patterns
Traditional chart patterns identify the behavior of traders and investors on a chart based on support and resistance trend lines. The purpose of these patterns are to identify the path of least resistance that signals the highest probability of the next swing or trend in price action based on the previous moves around key areas of support and resistance. The breakouts of previous trading ranges are generally the new directional entry signals.
Harmonic Chart Patterns
Harmonic Patterns use the identification of quantified chart price action structures that have specific and consecutive Fibonacci ratio alignments that form the visual structures. Harmonic patterns calculate the Fibonacci levels of the price patterns to identify high probability reversal points on the charts. This method believes that harmonic patterns or cycles repeat on charts repeatedly. The key to using this strategy is to identify these patterns and to use them for creating good risk/reward ratio entries and to exit when a profit target is reached. Positions are taken based upon the odds that the same historic patterns will repeat after entry.
Candlestick Patterns
Candlesticks are a type of chart setting that shows price action more visually based on the opening and closing prices along with any movement outside the candle range with wicks above and below. Candlesticks can be used to construct their own types of patterns signaling momentum shifts or continuation of the current move on charts for managing entries and exits.

How do you spot a chart pattern?
Trading chart patterns are identified by connecting trend lines at areas of price support below and areas of price resistance above the current range of price action.
The primary harmonic chart patterns contain 5-points like the Gartley, Butterfly, Crab, Bat, Shark and Cypher patterns. These harmonic patterns also have embedded 3-point A-B-C or 4-point A-B-C-D pattern points of reference. All the price action swings between these points are related to each other and should have harmonic ratios based on the Fibonacci sequence to quantify them.
Candlestick patterns can be identified both manually based on the visual patterns they create or using software (TrendSpider) and scanning a watchlist or index for specific candlestick patterns in real time.
Do chart patterns actually work?
Chart patterns have been shown historically to have an edge in directional predictions over random entries in many studies, however whether they “work” or not for an individual trader has more to do with how they are used to enter and manage their trades and also the quality of the watchlist of markets and stocks they use to trade them with.
Chart patterns are best used to identify the current path of least resistance on the chart, momentum, and to set the parameters for risk management by quantifying stop losses as well as projecting potential profit targets. They are tools for identifying and managing trades to increase the probabilities and magnitude of profits more than for predicting the future.
For a deeper look into all these different technical analysis patterns you can check out my books on chart patterns, candlestick patterns, and technical analysis here.


