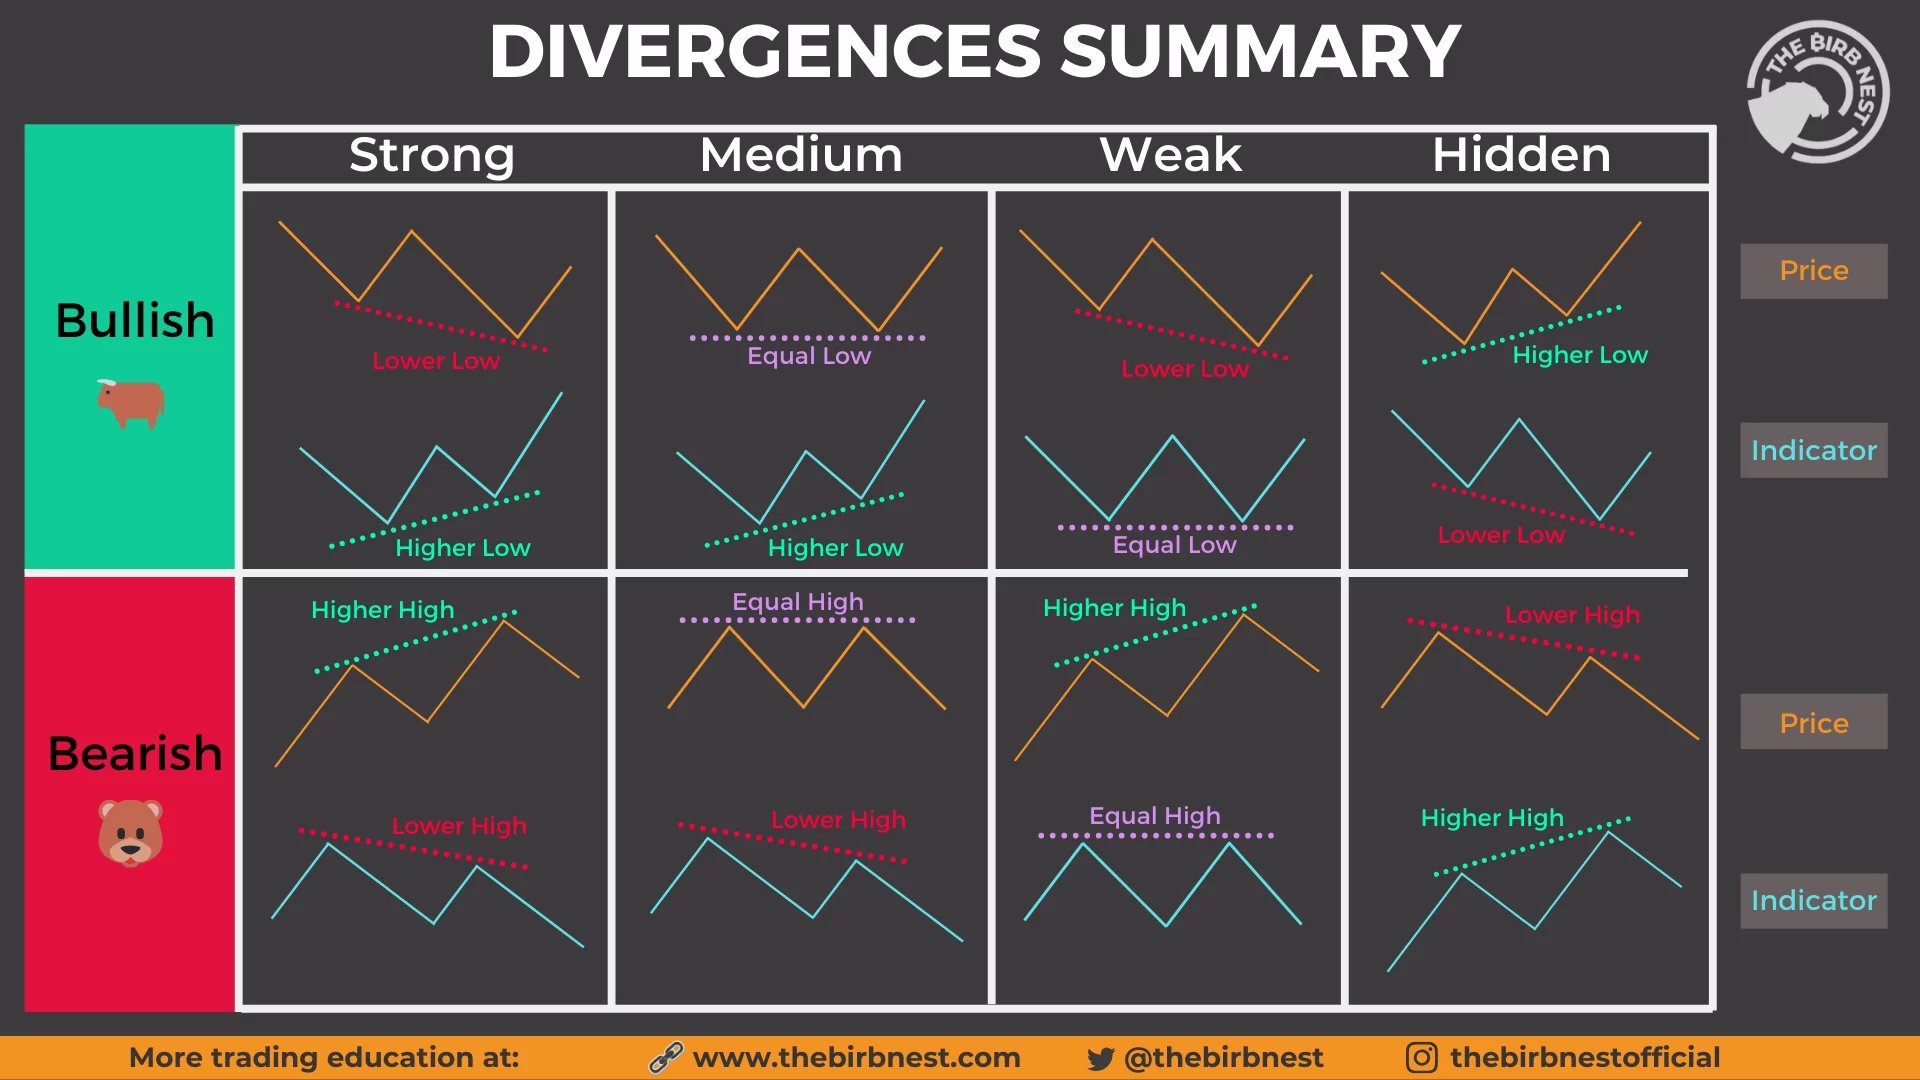
 RSI divergence signals show traders when price action and the RSI are no longer showing the same momentum. The RSI shows the magnitude of a price move in a specific timeframe. The RSI is one of the most popular oscillators used in technical analysis. A divergence shows the relation between the RSI and current price action is becoming uncorrelated.
If a chart has a RSI divergence then the relative strength index (RSI) on the chart has lower highs when price is at a higher high or the RSI makes higher lows when price makes new lower lows. When RSI stops breaking out to higher highs during an uptrend in price or breaking down to lower lows when price is in a down trend then it is said to be an RSI divergence.
A divergence is a signal that the current trend in the time frame on the chart has lost momentum. This is a possible signal and set up to bet on a reversal in the direction of the market price action. An RSI divergence is saying that the indicator does not agree with the price action.
Bullish Divergence RSI
A bullish RSI divergence pattern is defined on a chart when price makes new lower lows but the RSI technical indicator doesn’t make a new low at the same time. This is a signal that bearish sentiment is losing momentum with the high probability that buyers are stepping in and the market may be near a bottom on the chart’s time frame. In many instances a bullish divergence can be the key indication on a chart that signals the end of a downtrend and that the risk/reward ratio has shifted in the favor of the bulls.

Strong Bullish Divergence
Price makes a lower low but the RSI indicator makes a higher low.
Medium Bullish Divergence
Price makes an equal low but the RSI indicator makes a higher low.
Weak Bullish Divergence
Price makes a lower low but the RSI indicator makes an equal low.
Hidden Bullish Divergence
Price makes a higher low but the RSI indicator makes a lower low.
Bearish Divergence RSI
A bearish RSI divergence pattern is defined on a chart when prices make new higher highs but the RSI technical indicator doesn’t make a new high at the same time. This is a signal that bullish sentiment is losing momentum with the high probability that sellers are stepping in and the market may be near a top on the chart’s time frame. In many instances a bearish divergence can be the key indication on a chart that signals the end of an uptrend and that the risk/reward ratio has shifted in the favor of the bears.


Strong Bearish Divergence
Price makes a higher high but the RSI indicator makes a lower low.
Medium Bearish Divergence
Price makes an equal high but the RSI indicator makes a lower high.
Weak Bearish Divergence
Price makes a higher high but the RSI indicator makes an equal high.
Hidden Bearish Divergence
Price makes a lower high but the RSI indicator makes a higher high.
RSI Divergence Strategy
The RSI divergence strategy is to buy the dip during a bullish RSI divergence or sell short near the end of an uptrend during a bearish RSI divergence. This can create one of the best risk/reward ratios when a long term trend is losing momentum and about to reverse in the opposite direction. Of course stop losses and trailing stops must be used to manage the trade outcome to maximize the gain or minimize the loss.
You can learn about more technical indicator signals in my book The Ultimate Guide to Technical Analysis available on Amazon.