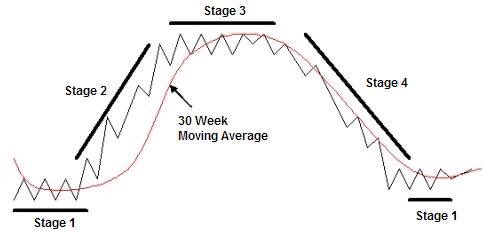
Stan Weinstein’s Secrets For Profiting in Bull and Bear Markets book explains stock market action into different phases that explains price action within cycles of bottoms, breakouts, uptrends, tops, breakdowns and downtrends.
Stage 1 Stock Market Bottoms
A chart makes a bottom as the market runs out of sellers at lower prices and begins to create a price range and a new sideways base.
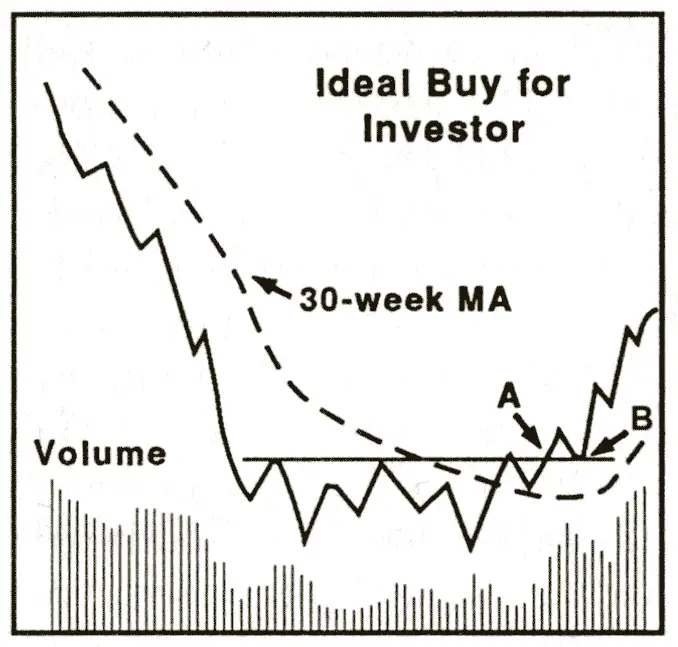
Stage 2 Stock Market Uptrends
Uptrends begin as investors begin to accumulate positions at low prices until they run out of sellers at lower prices inside the trading range and create a breakout in prices to higher levels. Uptrends make higher highs and higher lows and rotate between ascending price ranges and new breakouts. In uptrends, dips in price action are bought as they are opportunities to enter at lower prices.
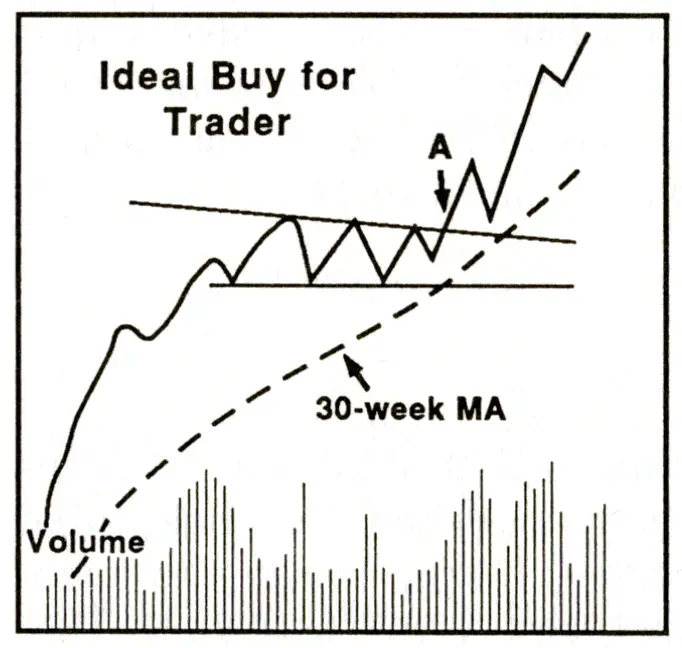
Stage 3 Stock Market Tops
Tops take time to form on a chart as distribution happens at high price levels. Many times a top has a head and shoulders chart pattern as buyers fail to take prices higher multiple times and the top price level is put in. This happens when a chart runs out of new buyers at higher prices and profit taking takes a chart lower.
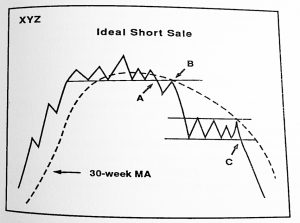
Stage 4 Stock Market Downtrends
Downtrends begin as fear of loss sets in and investors exit with remaining profits as a chart makes lower highs and lower lows. Trailing stop losses can trigger in cycles taking a chart lower. The best risk/reward ratio for short selling occur early in downtrends or at initial breakdowns to lower prices. Downtrends happen as stocks are distributed and large positions exited. Rallies are sold into as an opportunity to get out at higher prices.
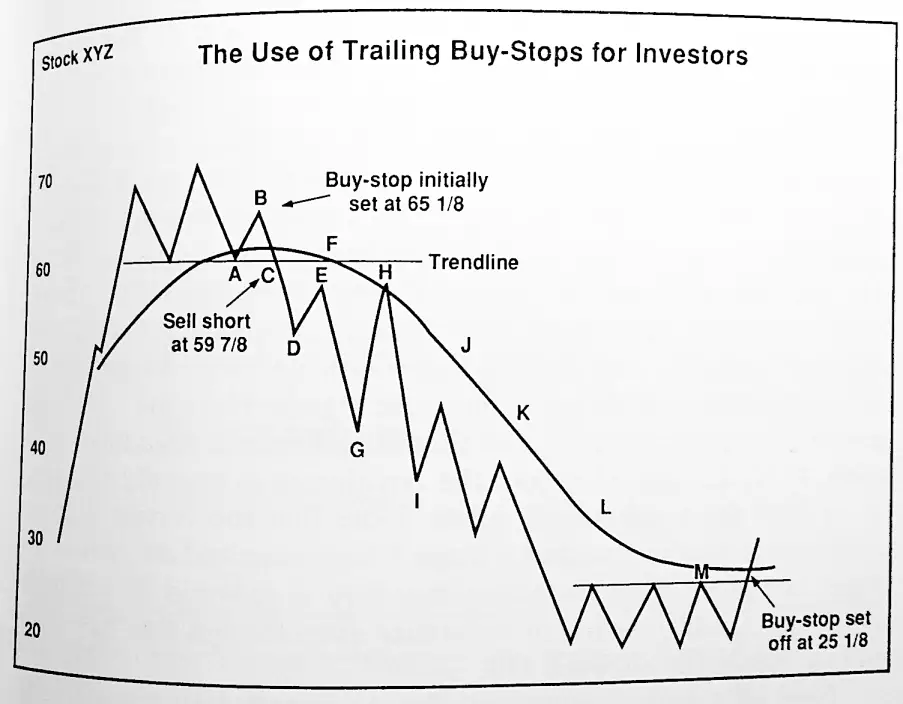
Understanding what phase of the market cycle a chart or the stock market is in can help understand the path of least resistance to trade with.
