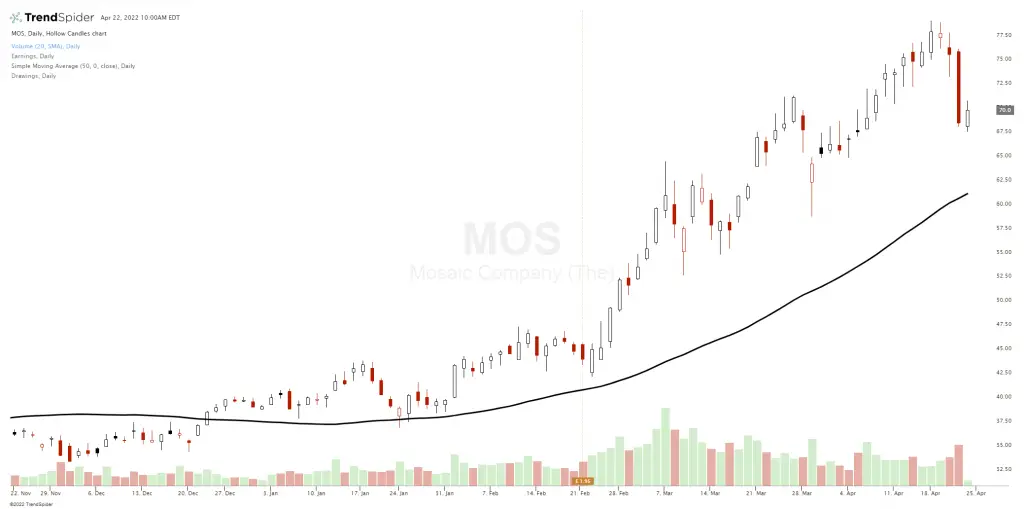
Chart courtesy of TrendSpider.comThe 50-day moving average strategy uses this line on a chart to filter whether a stock or index is in an uptrend or downtrend. Price above this line is bullish and prices below this line are bearish. Above this line traders should be thinking about long positions and below it they should be thinking about being in cash or short.
The 50-day moving average is the second most popular moving average commonly used by traders second only to the 200-day moving average. Many chart platforms have the 50-day moving average on their charts as the default setting.
50-day Moving Average Signals
Here are ten things to consider when using the 50-day moving average on your charts for trading.
The 50-day simple moving average is most common to use and has more meaningful dip buys at its level versus the 50-day exponential moving average.
The 50-day exponential moving average reacts faster than the 50-day simple moving average as it gives more weight in its formula to more recent prices.
The 50-day EMA is better to use when combining with shorter term moving averages for crossover signals like the 10-day EMA in my backtesting results.
The 50-day SMA is a great trend filter for growth stocks and shows that it is under accumulation while price is over this line.
Many times the first dips in price to the 50-day SMA for leading stocks and index ETFs will be bought during bull markets.
Price losing the 50-day SMA is a warning sign that an uptrend could be coming to an end at least in the short term.
An ascending 50-day SMA shows an uptrend on a chart, a descending one shows a downtrend, and the 50-day SMA going sideways shows a trading range for the time frame.
The 50-day moving average backtested as a standalone signal for entries or exits based on price breaking above and below it seldomly backtests well as its performance as a trend filter is hurt during choppy price action when too many false signals are given consecutively causing losing streaks. It is best used as a larger trend filter.
When using it as a trend indicator, other signals should be used for profit taking like a chart becoming overbought in the 70-RSI zone is a good time to lock in profits and not rising price all the way back down to the 50-day SMA.
Additional volatility filters like the Average True Range (ATR) can also be informative to know when it’s not a good filter for price action due to a wider trading range.
50-day Moving Average Short Signals
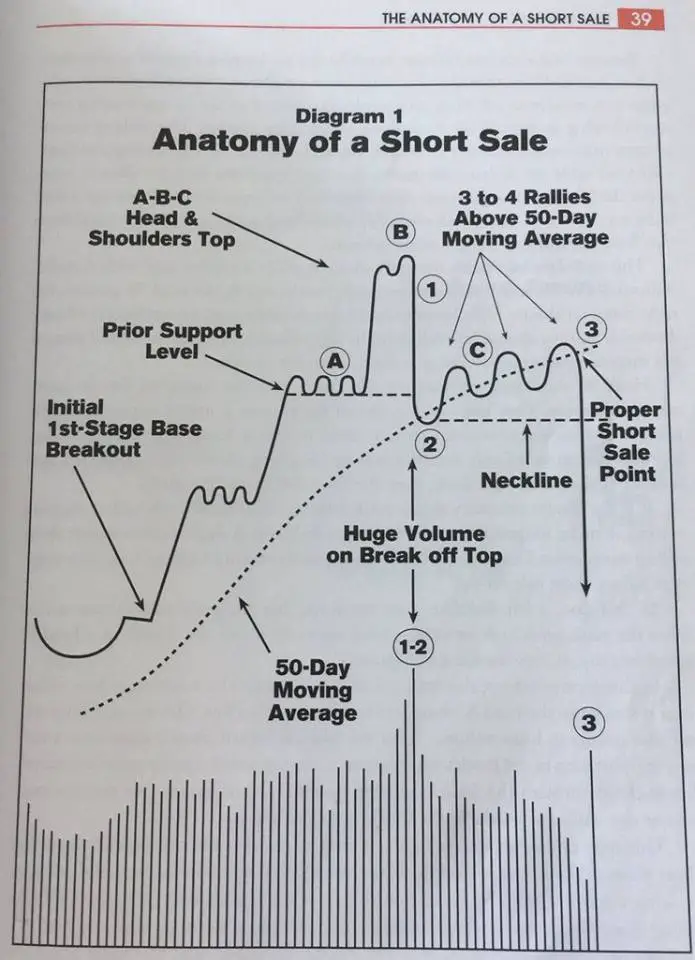
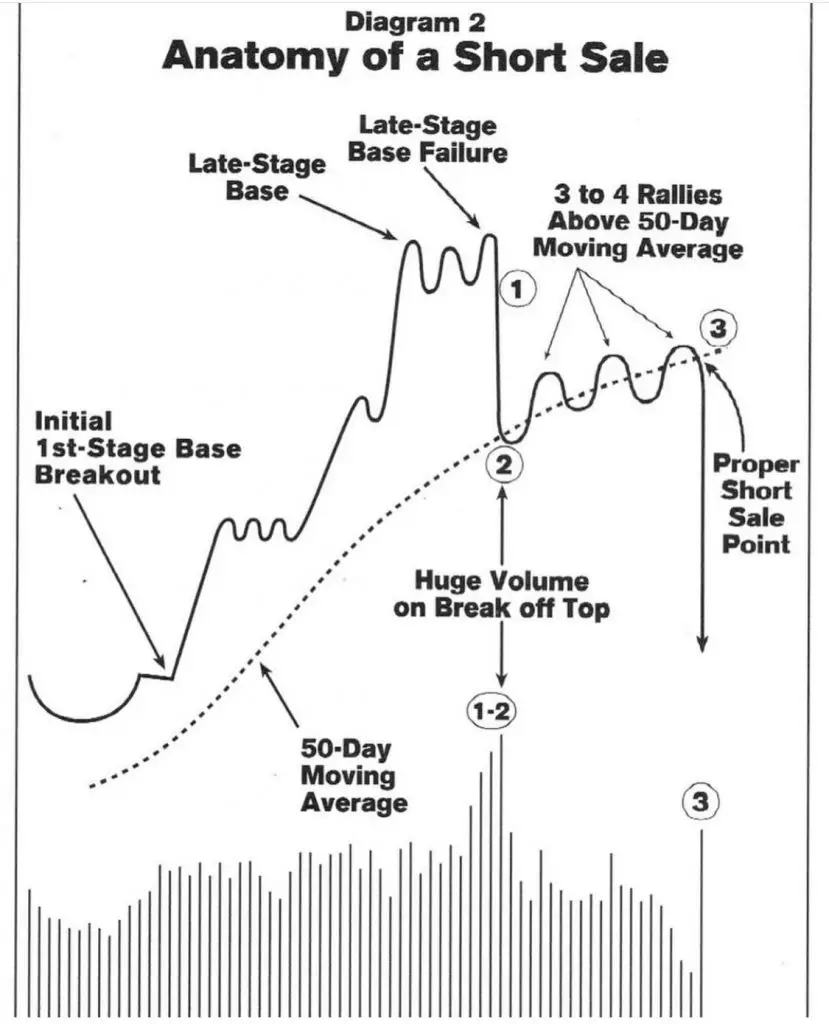
The 50-day moving average can also be a part of a short selling strategy when it is part of a bigger topping pattern on a chart, here are two examples of using it as a short sell set up.


From the book How to Make Money Selling Stocks Short
To learn more about how to trade using moving averages her are four of my books covering real world strategies.
Here are my three of my moving average eCourses where I show you how to trade and backtest moving averages:


