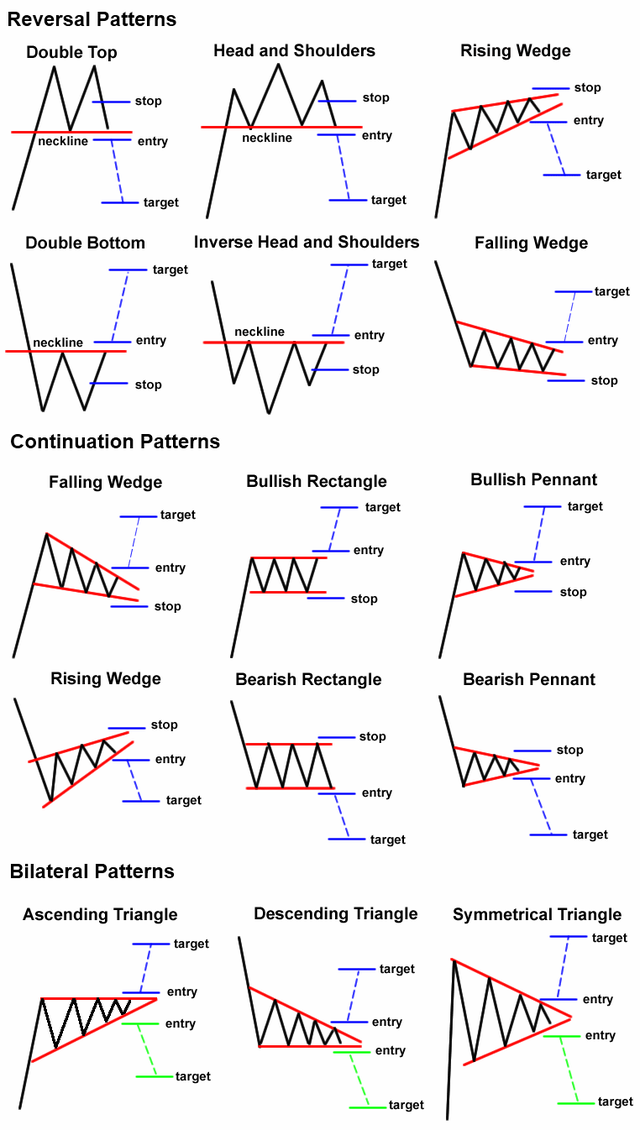
Chart patterns are visual representations of price action. Chart patterns can show trading ranges, swings, trends, and reversals in price action. The signal for buying and selling a chart pattern is usually a trend line breakout in one direction showing support or resistance is overcome at a key level. Stop losses are usually set on retracements back inside the previous range and profit targets are usually set based on the magnitude of the previous move leading into the pattern.
Many people think of chart patterns as bullish or bearish but there are really three main types of chart pattern groups: reversal chart patterns, continuation chart patterns, and bilateral chart patterns. Understanding the differences are important for traders to understand the path of least resistance on a specific chart based on the primary sentiment of the buyers and sellers price action.
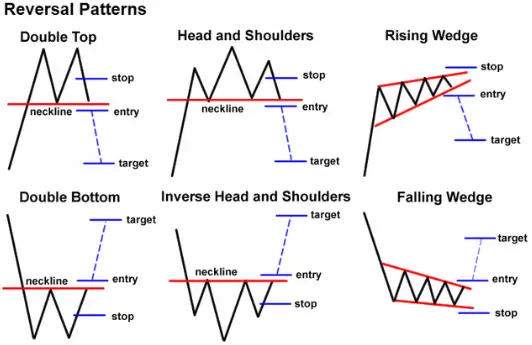
Reversal Chart Patterns
Reversal patterns happen when a chart has a strong break from its current trend and its momentum reverses course. These patterns show that a trend is coming to an end and the price action is moving in a new direction away from the previous range or direction. These patterns go from bullish to bearish or bearish to bullish. They can take longer to develop than other types of chart patterns.

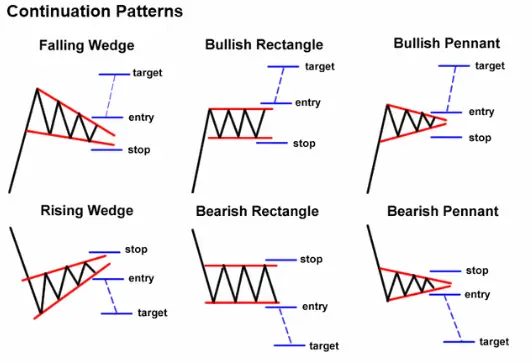
Continuation Chart Patterns
Continuation patterns signal that the current trend is still in place and it’s about to resume going in the same direction after a trading range has formed. These types of patterns usually form consolidations in price action to let buyers and sellers work through supply and demand before moving higher or lower like the previous trend leading into the range. These are the most popular classic bearish and bullish chart patterns.

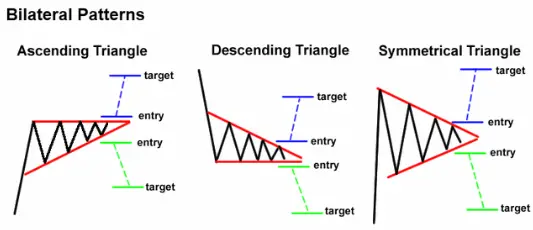
Bilateral Chart Patterns
Bilateral patterns are neutral in movement and show that price can breakout in either direction. These are usually symmetrical price action ranges that show equal support and resistance trend lines as price consolidates there is no advantage seen by the buyers or sellers as the upper trend line declines and the lower trend line ascends equally. The previous trend in price before the triangle can many times also be unclear or has been a range as well. These types of charts are like Schrodinger’s patterns as they are both bullish and bearish until price breaks out in one direction showing which direction has an edge in the next trend.

It is important to identify which type of chart pattern you are observing to key in on the right sentiment of buyers and sellers to understand the probabilities of the next directional move in price.
For a deep dive education on chart patterns you can check out my book The Ultimate Guide to Chart Patterns available here on Amazon.