Many people wonder what the difference in performance is between the stock market and gold over the long term. Historically stocks are thought of as investments that grow as the underlying companies earnings grow and dividends are paid, they are equities as an asset class. Gold is thought of more as a hedge against inflation and a preservation of value versus fiat government currencies that are consistently devalued, it is the most popular precious metal and used throughout the history of civilization for trade and commerce.
The S&P 500 index is one of the most popular representation of the stock market and for this data I will be using the SPDR S&P 500 ETF Trust SPY. For gold I will be using the SPDR Gold Shares exchange traded fund GLD.
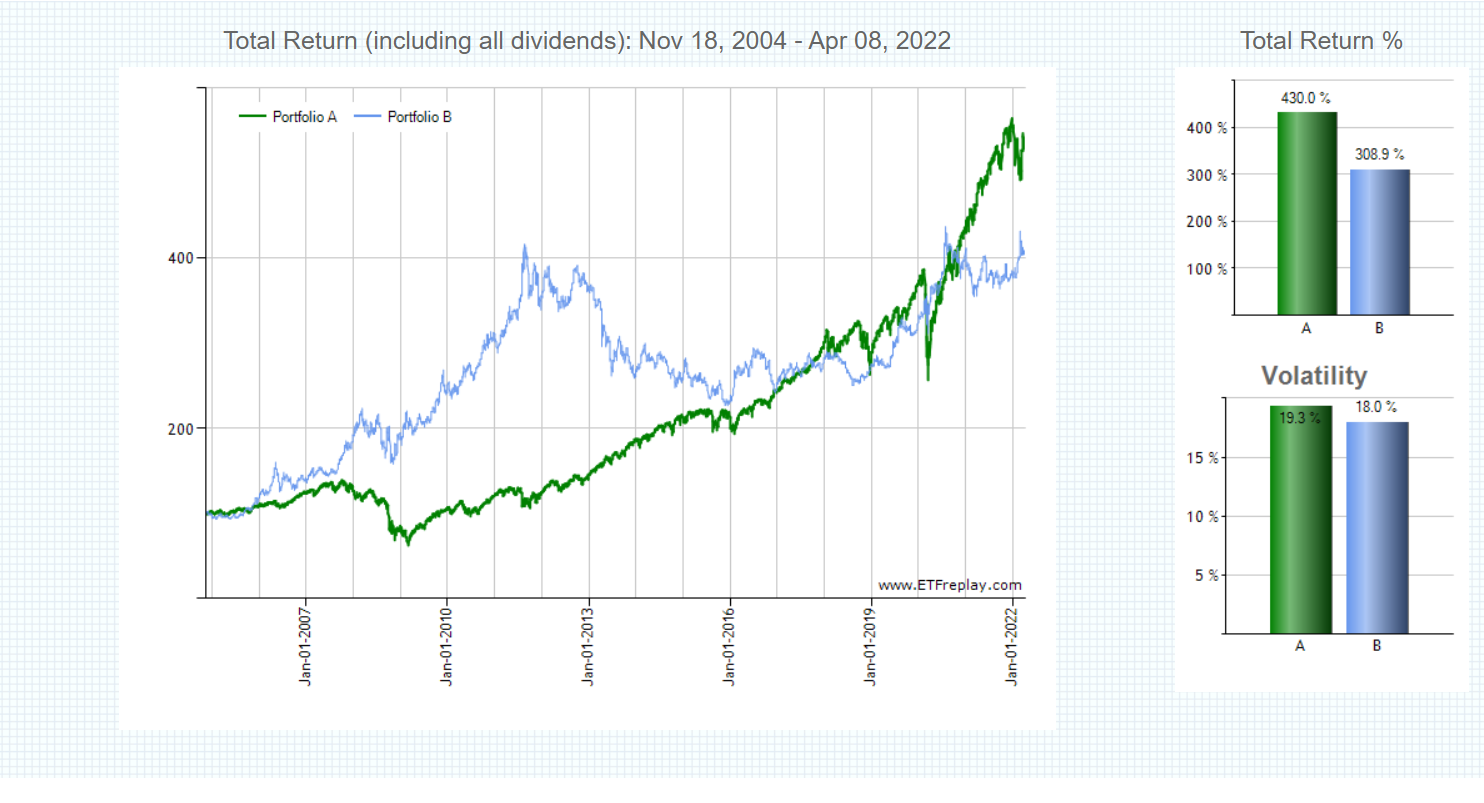
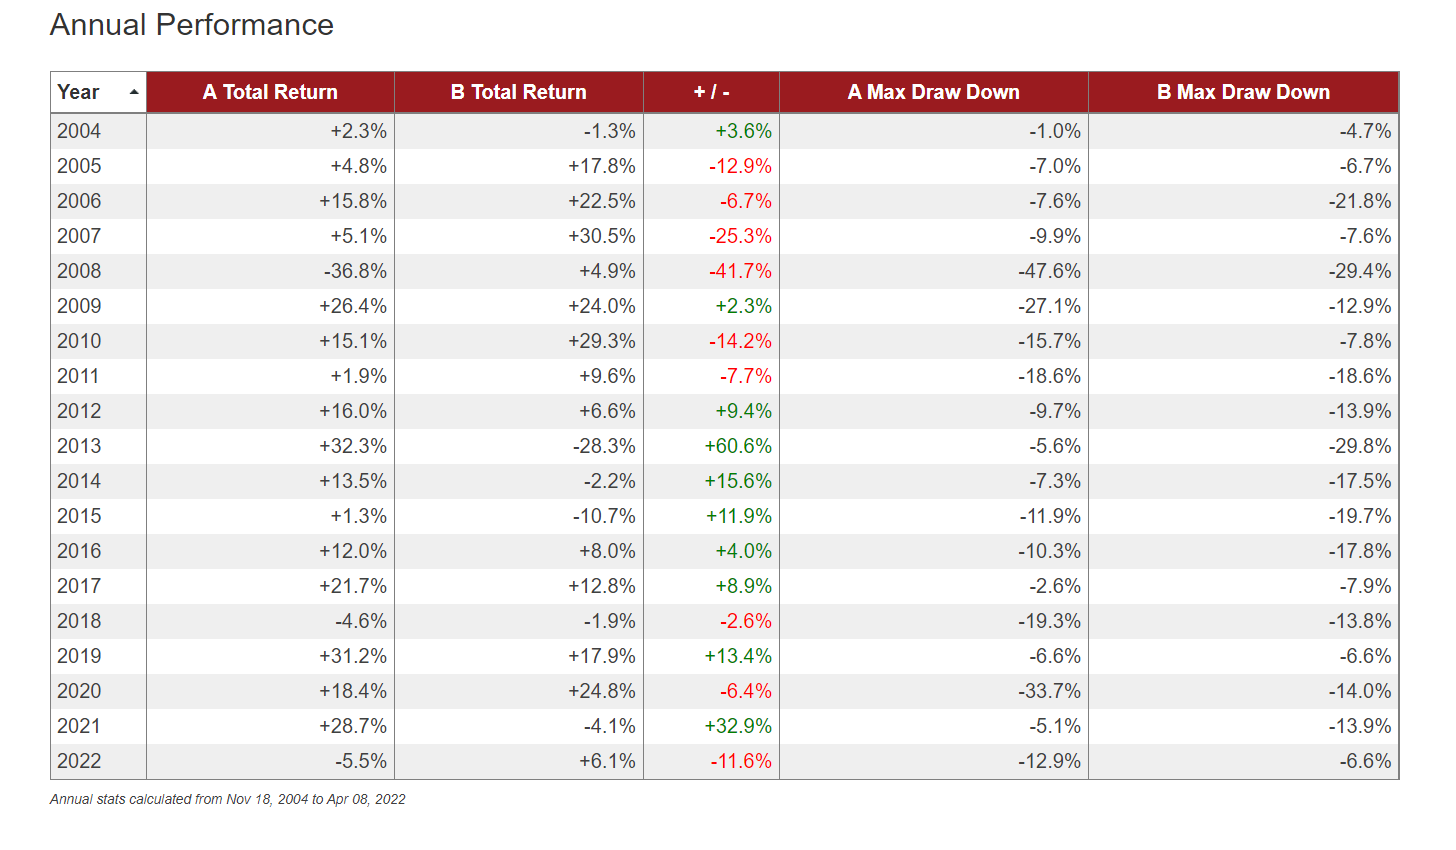
You can see the annual return and annual drawdown in the below tables as well and the total returns from 2004 to present along with the maximum drawdown and risk metrics.
You can see for yourself how gold does during stock market drawdowns and over the long term.
Gold versus S&P 500


Stocks vs Gold
Volatility is the range of price change over a period of time. When price stays relatively stable, it has low volatility. A highly volatile security makes highs and lows fast and moves more erratically showing quick increases and falls of high magnitude in price action.

Stock Market Historical Returns vs Gold

SPY vs GLD Risk Metrics
CAGR is not an actual rate of return, it is a representation of a smoothing of returns. It is a number that expresses the rate an investment would have grown with the same rate of return each year with the new capital reinvested each year. This sort of precise measurement of performance is just a smoothing performance not an accurate reading of future returns. CAGR is used to easily understand comparative returns from multiple investment strategies or systems.
A CAGR smooths out the fluctuations in returns for an investment’s performance and prevents outlying years from distorting the final result.
In investing, correlation is a statistic that measures the degree that two securities move in relation to each other directionally and in magnitude. Correlations are used for managing portfolios by understanding the risk of holding investments that move together on average. When computed as the correlation coefficient it has a value within the -1.0 and +1.0 range.
The Sharpe Ratio is the defined difference of the returns between an investment and the potential risk free return that is then divided by the standard deviation/volatility of the investment as a comparison. The Sharpe Ratio is a representation of the returns above what an investor would receive per unit of the increase in risk.
The max drawdown from the start of the time period shows the maximum loss in price in percentage terms from an equity peak.

