 Wyckoff Theory
Wyckoff Method
Richard Wyckoff was a famous trader, author, and technician from the 1920s. He founded the Wyckoff Stock Market Institute to study technicals and market price action. He developed a market model for a way of looking at the patterns that accumulation and distribution create on charts.
Wyckoff Pattern
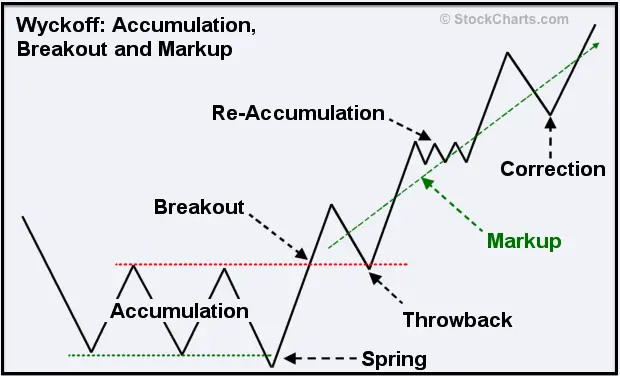
A Wyckoff Spring is a signal he quantified that occurs when a chart falls below its support and makes a new panic low but then springs back into its previous trading range. It’s a rare signal that usually occurs near market bottoms and usually happens during the last sell off on a chart.
Wyckoff Springs show an imbalance in the supply/demand in a market. After making a new low, price rallies and then returns to the previous supply zone by returning to that area on a move back up. It’s the loss of support and drop into an oversold level on a chart that finds new demand and bounces back over old support. In a Wyckoff Spring old support doesn’t become new resistance, price breaks back into the old trading range.
Price doesn’t stay under the last swing lows because there’s no supply from sellers to keep it down. The demand from buyers forces price action back up over the last swing low support. If there is no selling pressure at lower prices then demand will come in and the chart will rally.
Wyckoff Springs can occur in any market and on any time frame. Considering higher time frame charts can help increase the odds of success by looking at the multiple time frame trends. Market context is important to consider when using this signal as it has a higher probability of success when it occurs near other confluences of technical signals like oversold levels, key moving averages, or historical previous long term support on the chart.
Wyckoff Accumulation
