Guide to Chart Patterns
Price action creates chart patterns in the financial markets through the buying and selling of positions by traders and investors. A chart pattern is a visual record of the votes by bulls and bears at different price levels.
A chart pattern is simply a visual representation of the prices buyers and sellers bought and sold in the past. There is no magic in a chart pattern they just show you what happened in the past and what has a higher probability of happening in the future.
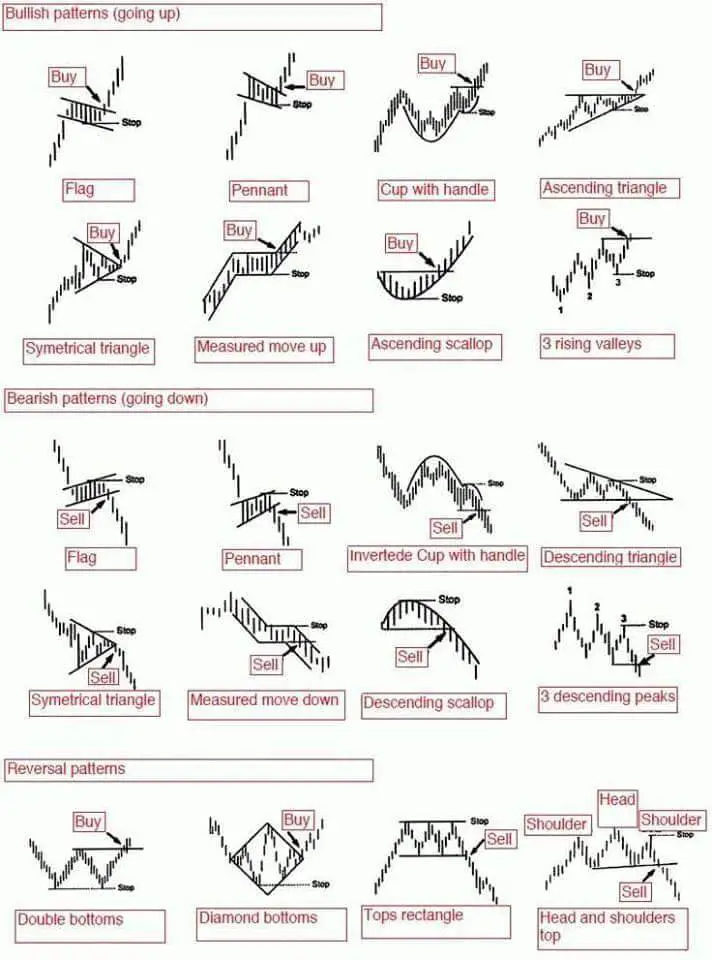
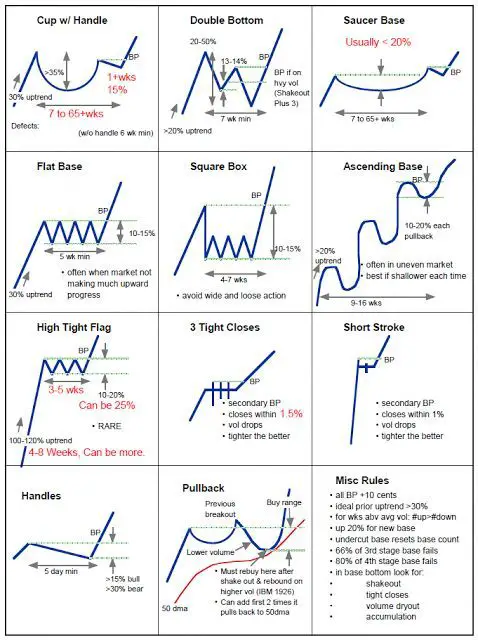
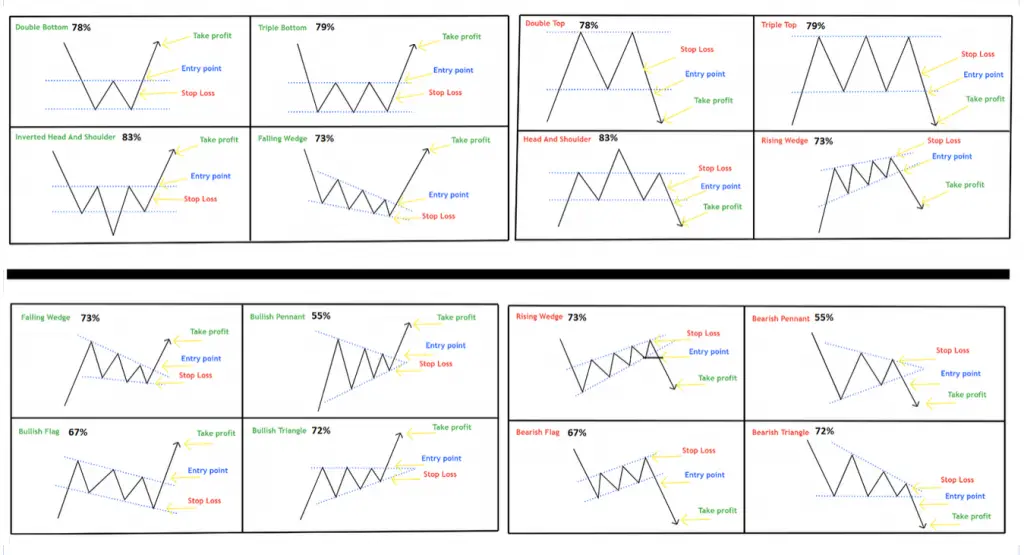
There are different types of chart patterns. Continuation chart patterns that confirm a trend is going to continue in the current direction and also reversal patterns that signal a trend is likely to reverse.
A chart pattern can show that a stock is in a range with defined resistance and support. A chart can also show an uptrend of higher highs and higher lows are a downtrend of lower highs and lower lows.
Chart patterns can be bullish, bearish, or show a price reversal depending on the direction of the momentum. They can also be used as risk management tools showing where to set stop losses if a breakout fails or set profit targets for a continuation.
The most popular use of chart patterns is for breakout trading signals as the probability increases of a move in a specific direction after a price breakout of a previous support or resistance.
A chart pattern is a visual tool for seeing which direction a market is moving in.
While the fundamentals can show an investor what stock to buy, a chart pattern can show a trader when to buy it and when to sell it.
Basic Chart Patterns

Advanced Chart Patterns

My chart pattern articles table of contents with links:
What Causes a Chart Pattern?
How to Draw Trendlines on a Chart
Bullish Pennant pattern
Bullish Flag pattern
Bearish Flag pattern
Rising Wedge pattern
Falling Wedge pattern
Triangles pattern
Symmetric Triangles pattern
Ascending Triangles pattern
Descending Triangles pattern
Cup and Handle pattern
Inverse Cup and Handle pattern
Reversal Patterns
Head and Shoulders pattern
Inverse Head and Shoulders pattern
Double Top pattern
Double Bottom pattern
Triple Top pattern
Price Gaps
Breakaway Gaps
Exhaustion Gaps
