The Butterfly Pattern uses the identification of quantified structures on a chart that has specific and sequential Fibonacci ratio alignments that show harmonic patterns. These patterns calculate and measure the Fibonacci aspects of the price action structures to signal reversal points with a good probability of success.
Traders using harmonic patterns as a trading method believe that these types of patterns or chart and market cycles repeat over time. The key to profitably using the butterfly pattern is to identify the favorable risk/reward set up on extensions in price, betting on a reversal and to enter a trade based on a high probability that the same repeating swings will occur.
The Bullish Butterfly Pattern is a reversal pattern with four distinct swings in price or legs, it is similar to both the Bullish Gartley and Bullish Bat Patterns.
The butterfly pattern tries to identify when a current price swing in progress is likely getting near its end. This is a reversal chart pattern with traders trying to enter a trade on the chart as the price action reverses its current direction.
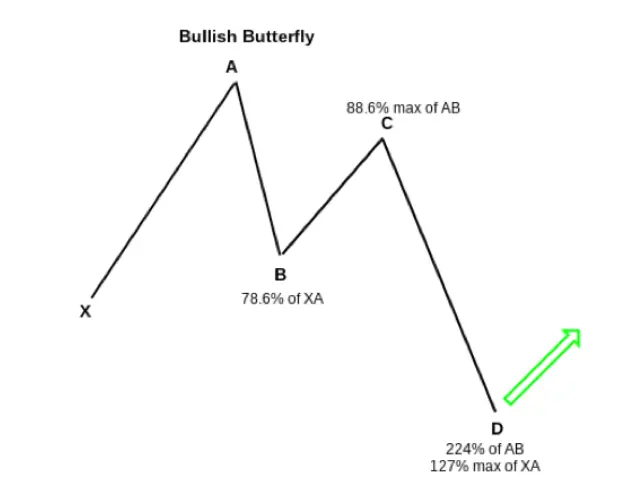
This is what the bullish butterfly chart pattern looks like:

Image created by Tradeciety.com
The first swing up is created when the price rises from the starting point X to the ending point A.
The A to B swing down in price is a reversal in direction and retraces approximately 78.6% of the price move of the X to A move higher.
The B to C swing back up is the next directional change and price rises back up with a retracement of between 38.2% to 88.6% of the price swing of the A to B downswing.
The C to D swing lower and breakdown is the last part of the butterfly pattern and is important for confirmation and completion. This harmonic pattern has close to a AB=CD price structure, but the C to D downswing frequently breaks down creating a 127%, 161.8%, or even a 224% price extension of the A to B downswing. Traders commonly use the point D price level at the end of the pattern to buy and oversold dip seeing it as a good risk/reward ratio after the oversold move.
The Bullish Butterfly Pattern is a reversal chart pattern that can show technical traders a high probability price level to buy the dip at a very overbought reading after a long move and extension in price from the mean creates a high probability for a retracement and swing back to the upside.