What is the RSI indicator?
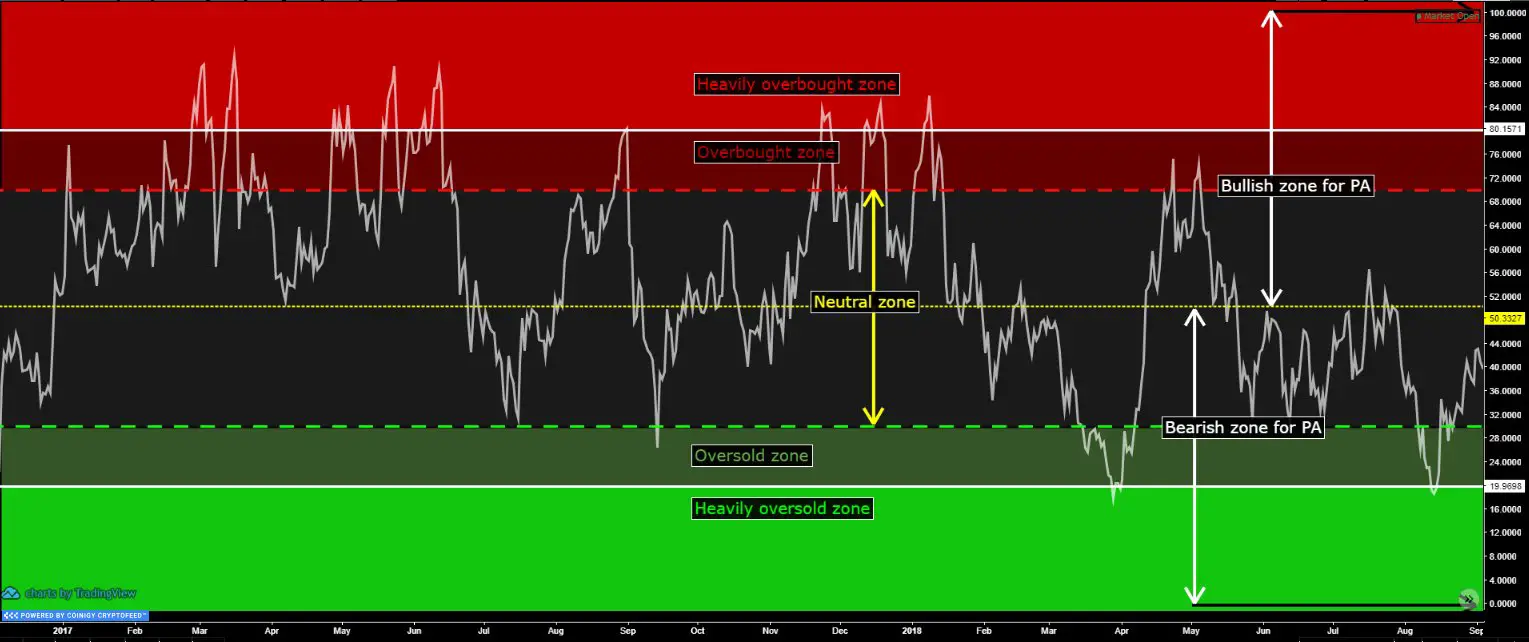
The RSI indicator buy and sell signals are based on oversold and overbought conditions on a stock chart. The RSI is a measurement of price moving too far and too fast in one direction and as the RSI gets extended farther from the 50 RSI middle line the probability of a reversion to that mean increases.
Think of the RSI as a risk/reward quantifier and the reward diminishes for long positions as a stock chart reaches the 70 RSI zone and the short sellers can see less potential reward as the RSI moves near the 30 RSI zone. The odds of successful dip buys increases as a chart reaches near the 30 RSI and short selling has a greater chance of success near the 70 RSI.
The RSI works best in range bound markets for identifying the boundaries of potential support and resistance. In a strongly trending market a break above the 70 RSI can be a short term momentum signal to the upside and a breakdown below the 30 RSI can signal the start of a deeper downtrend in the short term. As a trend continuation indicator the breaking of the 30 or 70 RSI boundaries can signal a potential parabolic move beginning that can’t be contained in the near term. Approximately 95% of price action on a chart tends to happen inside the bounds of the 70/30 RSI resistance and support levels.
In downtrends a chart can see a key price bounce zone near the 30 RSI but a resistance area come into play at the 50 RSI. In uptrends a chart can see dip buyers come in at pullbacks to the 50 RSI and see resistance at the 70 RSI.
The most common chart context used for the RSI is a setting at a 14-day parameter and on a daily chart. An RSI can be used on all timeframes but should be looked at historically for a reference point on how it should work on a specific chart in a trading time period based on historical price action behavior. Some stock charts tend to go parabolic, some tend to trend to those boundaries, and others can go sideways for long periods of time.
Here is a great RSI Cheat Sheet shared by @Crypt0fons on Twitter.

Image source:
If you are fairly new to TA and are using RSI as an indicator, I suggest taking a look below🧐
RSI-zones cheat-sheet out of an article I wrote last month🙏$FONS 💡 pic.twitter.com/k67Zrmlcre— 🐃Fons the ethereum bulla🐃 (@Crypt0fons) February 12, 2019
