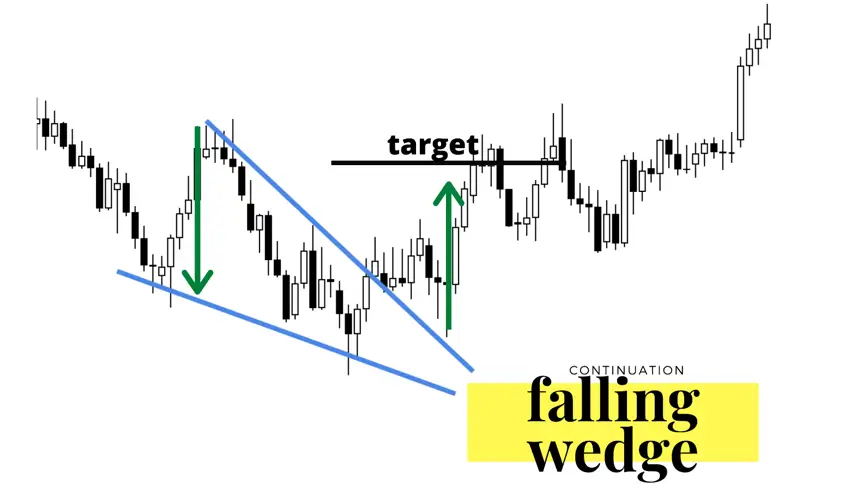
- The bullish wedge pattern shows price action falling in a downswing but breaks its descending upper resistance trend line to reverse higher into an uptrend.
- The falling wedge pattern can fit in the continuation or reversal category. When it is a continuation pattern it will trend down, however the slope in the wedge will be against the overall market uptrend. When it is a reversal pattern, the falling wedge trends down when the overall market is in a downtrend but breaks to the upside.
- The falling wedge has the potential to turn into a bullish pattern regardless of what kind of market it occurs in.
- The falling wedge is a bullish chart pattern that begins with a wide trading range at the top and contracts to a smaller trading range as prices trend down.
- This price action forms a descending cone shape that trends lower as the vertical highs and vertical lows move together to converge.
- The bullish bias in this pattern will not be signaled until a breakout back above the descending resistance to show this is a reversal pattern from lows in price.
- This is usually a longer-term pattern that generally forms over a three to six-month timeframe but can also appear on shorter time frames.
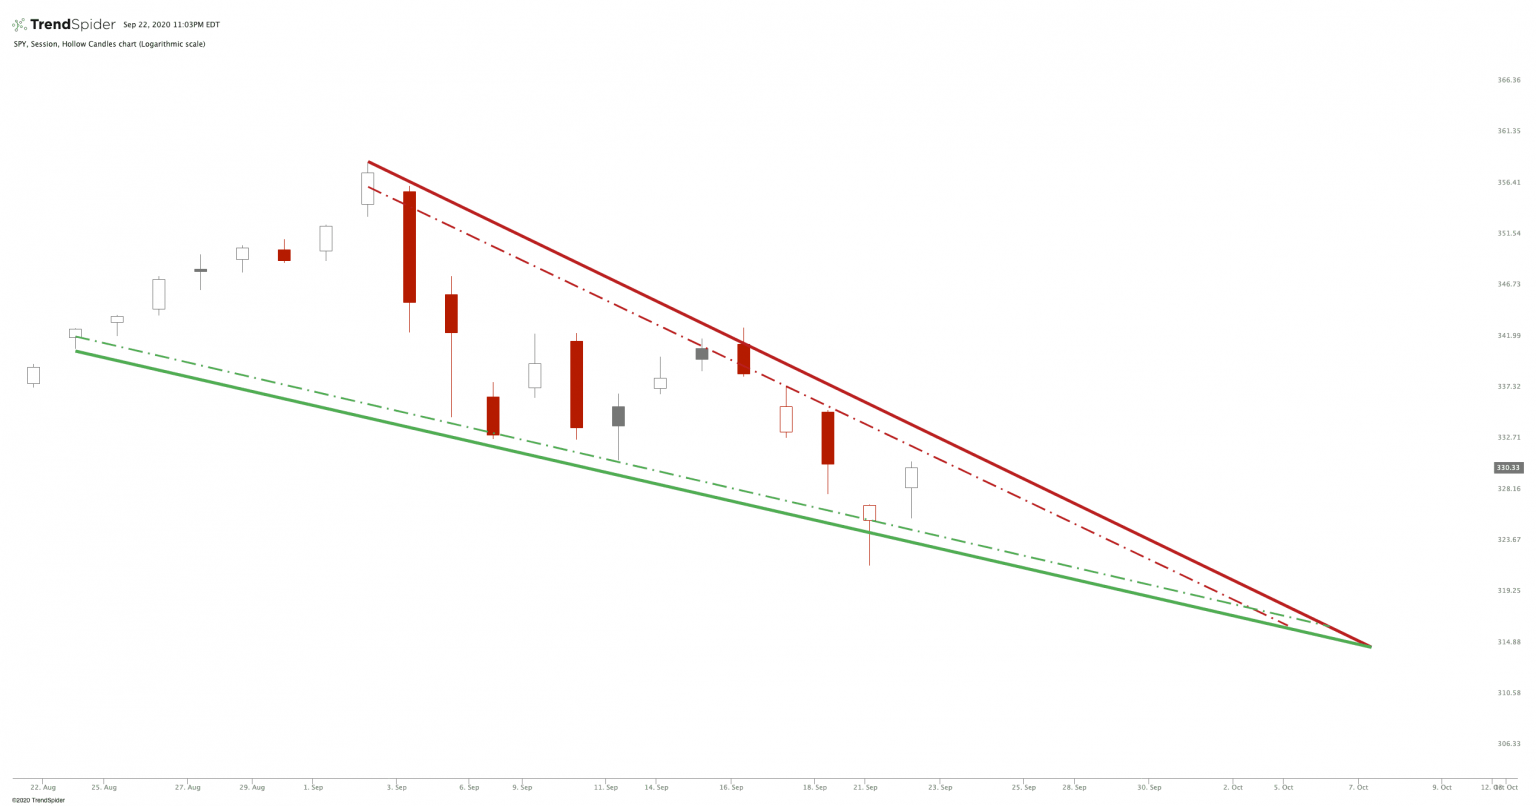
- This pattern creates lower lows, but the new lows should become less in magnitude. Less depth in lows indicate a decrease in the strength of selling pressure and should create a lower trend line of support with less declining slope than the upper line of resistance.
Notice that the $SPY chart below had lower lows and lower highs for several weeks creating a descending upper trend line. This chart pattern remains in place signaling a downtrend in price until the upper descending trend line is eventually broken by price to the upside. The break above the resistance line is a signal that the downtrend could be reversing and creating a potential signal that a new uptrend has begun.

Chart Summary: The falling wedge is generally a longer-term bullish chart pattern that has a declining line of resistance and a declining line of support. The reversal back above the descending upper trendline resistance is the bullish buy signal, it is not a pattern to buy during the downtrend. The lower support trendline should become more stable and flatter as the pattern forms showing selling pressure decreasing. As the lines converge the odds are that if the descending line of resistance is broken then this pattern is either a continuation of an uptrend if it is a bull market or a reversal from a near term price bottom if the pattern forms during a bear market.