Price action patterns are the visual moves that happen on the chart from the interaction between buyers and sellers at different price levels. At the candle level, a trader can see the micro price action and when the trader zooms out on the chart to a higher time frame they can see the full context of the chart pattern.
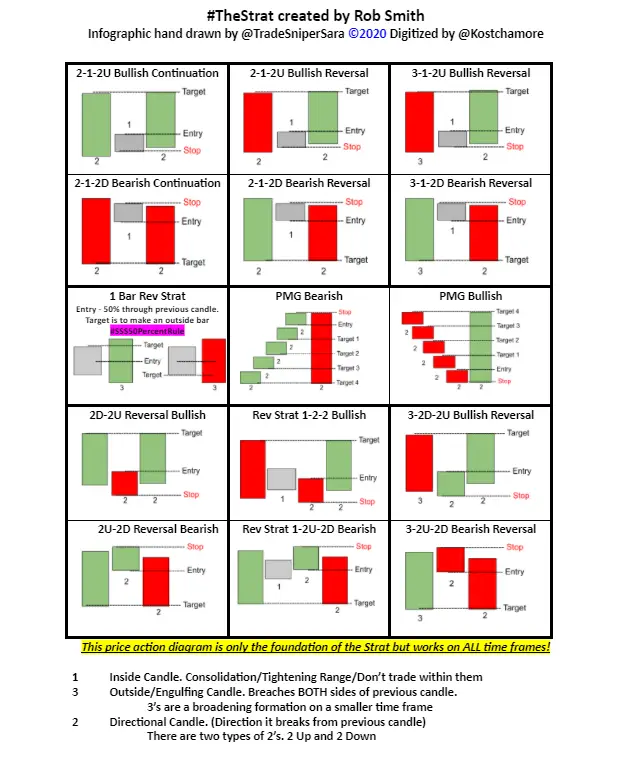
Here are some short term candle momentum signals for traders based on The Strat by Rob F. Smith. Image designed by Sara Strat Sniper.
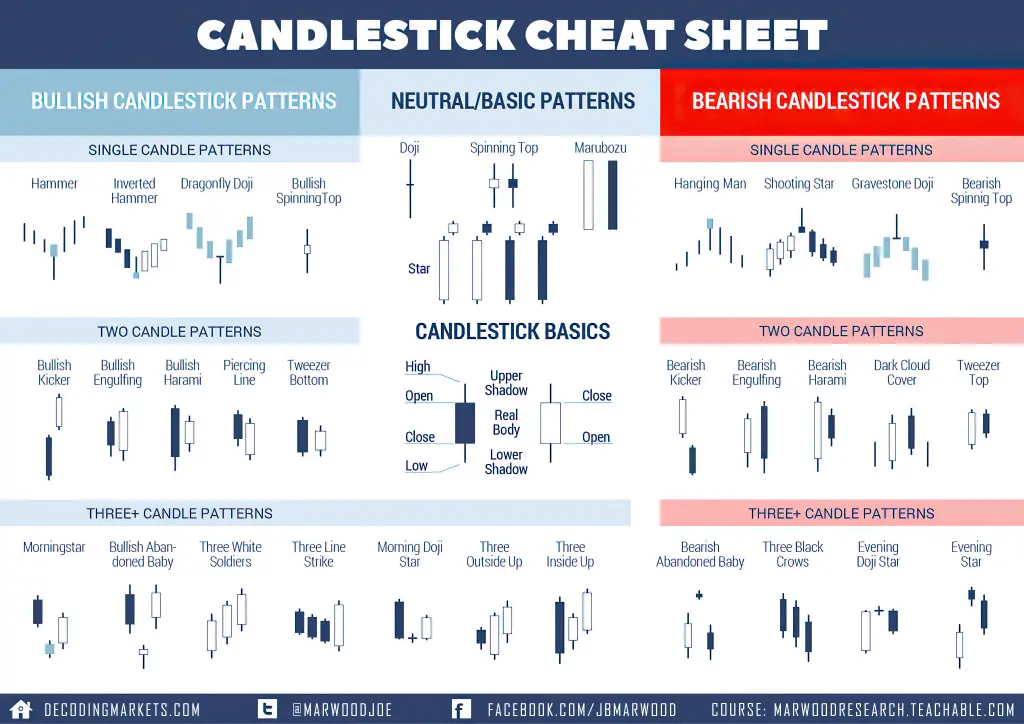
Here are some micro patterns that can form on a chart showing potential short term tops, bottoms, reversals, or momentum in price action.

Price action patterns show price levels where buyers are located on a chart through lower horizontal support lines, they show where sellers are coming in at upper horizontal higher resistance lines. Lower ascending vertical trend lines under price can show rising support levels in an uptrend while upper descending vertical trend lines above price can show resistance in a downtrend. Price action patterns can tell the trader whether a chart is trending up, trending down, or just going sideways. Volatility can be seen when the price range is expanding to wider and wider highs and lows.
Basic chart patterns:

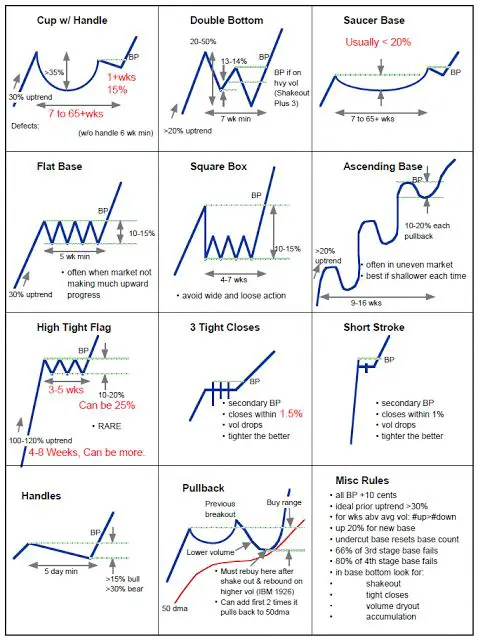
More defined complex chart patterns:

Trading price action patterns is an alternative choice versus trading opinions, predictions, or economic fundamentals. Price action patterns show what is actually happening on a chart versus what a trader thinks should be happening. They show the path of least resistance and can show the price levels to create favorable risk/reward ratios with and how to manage trades.
