Chart patterns provide context for applying key levels to trade off of on a chart. One group of similar chart patterns uses the XABCD harmonic chart pattern. The XABCD is a 4-legged group of reversal patterns.
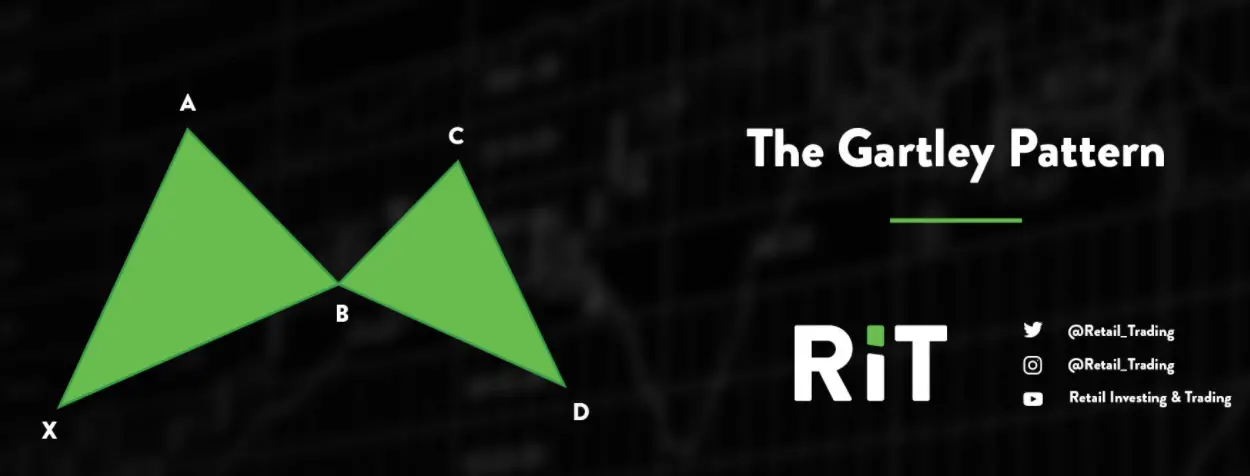
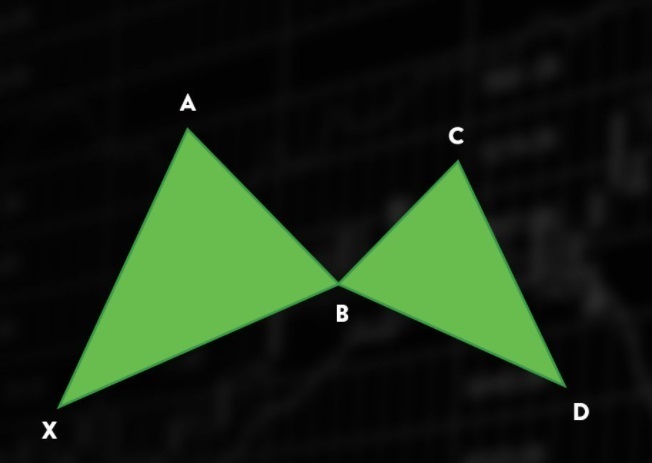
The XABCD pattern was first observed and noted by Harold McKinley Gartley. These types of patterns is a road map for technical analysts to quantify five key price points inside chart patterns. Traders can identify the five separate points of X, A, B, C, and D manually. The XABCD points make four distinct legs (or swings) that form the larger chart patterns. The four legs are labeled as XA, AB, BC, and CD.
The five key points (XABCD) quantify lows and highs in terms of the overall trend on the chart. The four legs XA, AB, BC, CD show smaller swings inside the bigger picture trend and directional move.
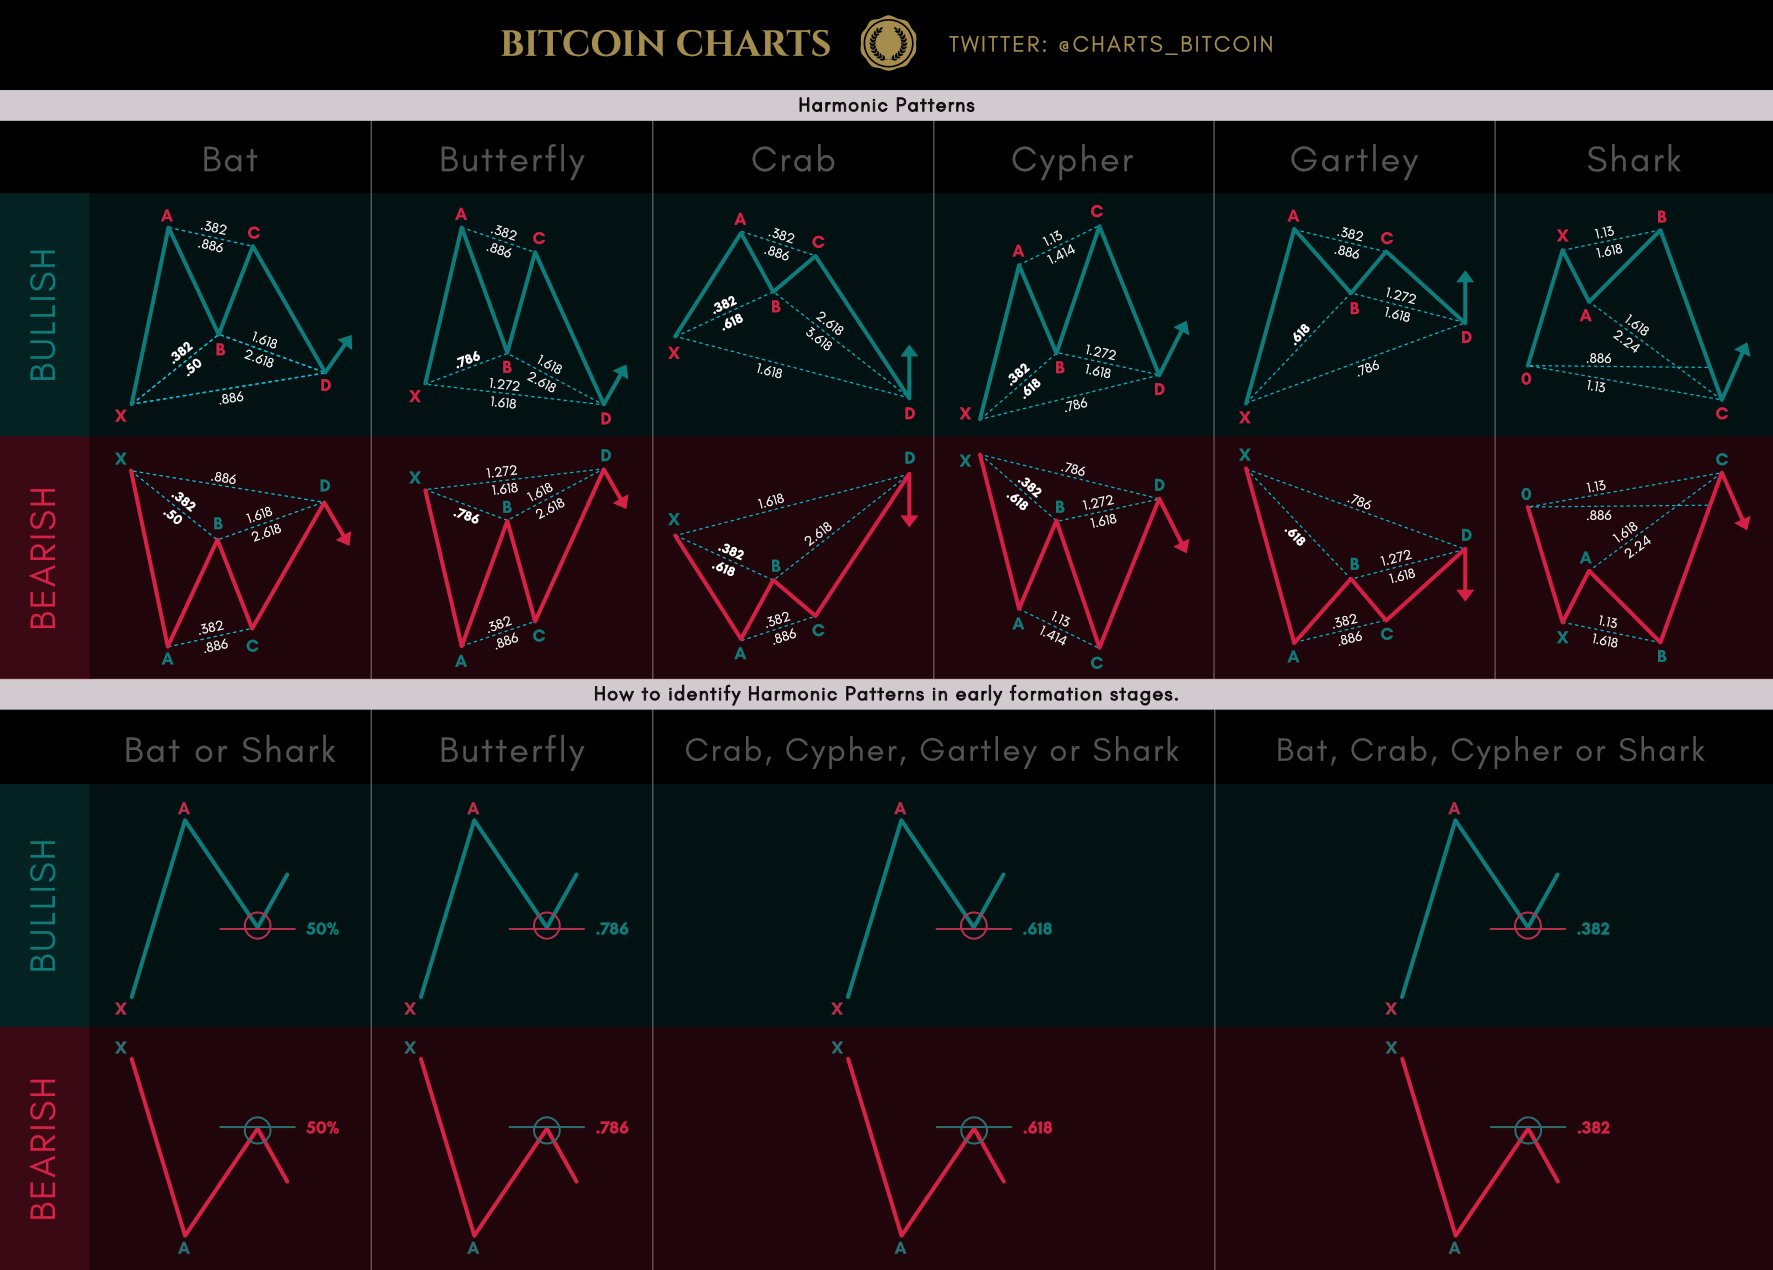
There are six major XABCD chart patterns used by harmonic traders listed below. There are both bearish or bullish variants of each.


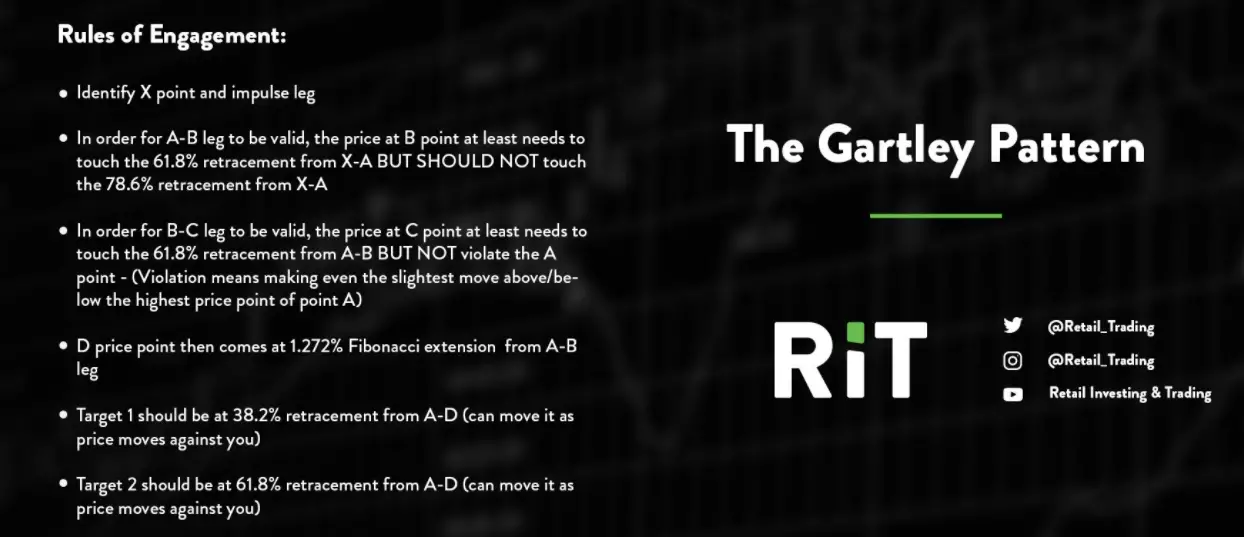
Images created by Ivan @retail_trading Free gift: Gartley infographic with rules available here.
Each variant has both a bearish and bullish variant and its own specific Fibonacci ratios.
Here is a cheat sheet for harmonic XABCD patterns:

