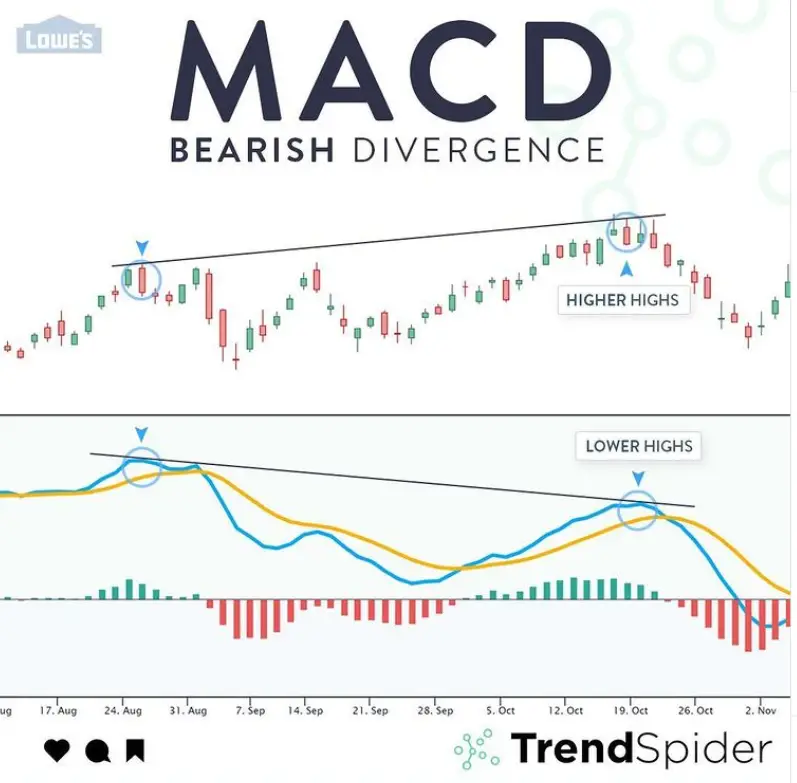
A bearish divergence pattern is defined on a chart when prices make new higher highs but a technical indicator that is an oscillator doesn’t make a new high at the same time. This is a signal that bullish sentiment is losing momentum with the high probability that sellers are stepping in and the market may be near a top on the chart’s time frame. In many instances a bearish divergence can be the key indication on a chart that signals the end of an uptrend and that the risk/reward ratio has shifted in the favor of the bears.
Technical oscillators used in identifying a divergence include the popular Relative Strength Index (RSI) and Moving Average Convergence-Divergence (MACD). The RSI not only measures the extremes of overbought (70) or oversold (30) but can also show divergences between it making lower lows while price is making higher highs. The MACD can not only signal bullish or bearish crosses but also its divergence with price action shows a lack of momentum in a move.
The RSI or MACD can be used as one way to filter price action and momentum but they can also be used in comparison with price as you look at direction of the indicators momentum versus the trend in price action. The divergence between the technical indicator and the price movement can signal changes in a trend and the probabilities of a reversal.
A bearish divergence is signaled when prices move higher but a technical indicator that is an oscillator moves lower. This is a valid technical signal to possibly go short based on technical analysis. Of course it is just a high probability, it doesn’t always work so proper position sizing is still required and stop losses must be used. Also the profitability is not in the entry it is in the exit so it is crucial to have a strategy in place for how you will both maximize and eventually lock in profits if it does work out as a winning trade.

Image courtesy of TrendSpider.com
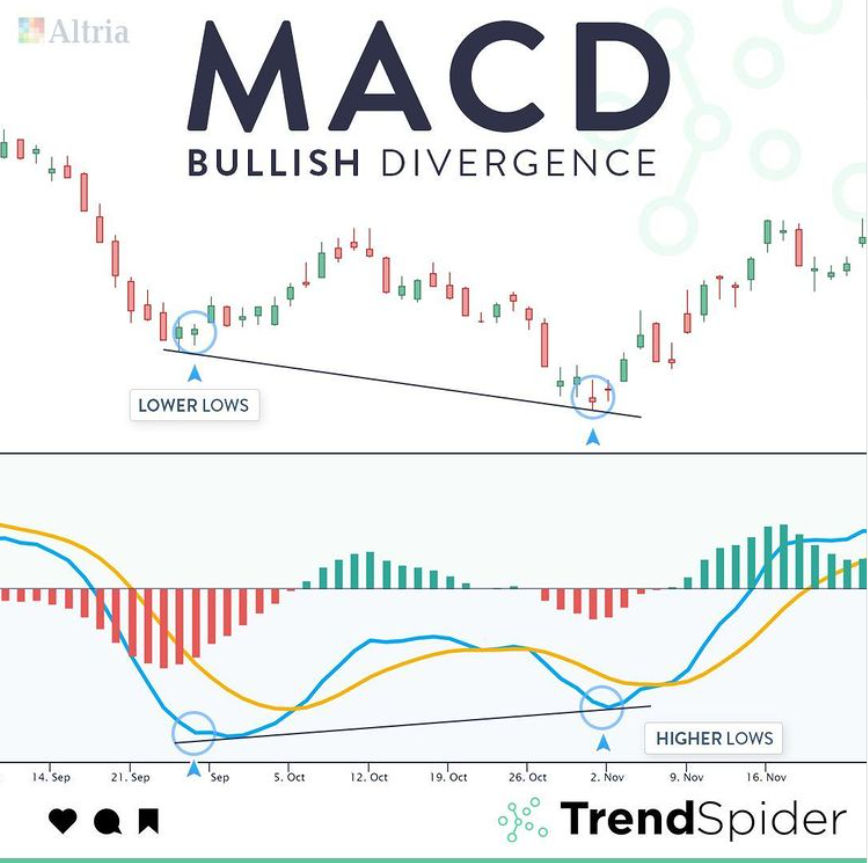
A bullish divergence pattern is defined on a chart when prices make new lower lows but a technical indicator that is an oscillator doesn’t make a new low at the same time. This is a signal that bearish sentiment is losing momentum with the high probability that buyers are stepping in and the market may be near a bottom on the chart’s time frame. In many instances a bullish divergence can be the key indication on a chart that signals the end of a downtrend and that the risk/reward ratio has shifted in the favor of the bulls.
Technical oscillators include the popular Relative Strength Index (RSI) and Moving Average Convergence-Divergence (MACD). The RSI not only measures the extremes of overbought (70) or oversold (30) but can also show divergences between it making lower lows and price not making lower lows. The MACD can not only signal bullish or bearish crosses but also its divergence with price action.
The RSI or MACD can be used as one way to filter price action and momentum but they can also be used in comparison with price as you look at direction of the indicators momentum versus the trend in price action. The divergence between the technical indicator and the price movement can signal changes in a trend and the probabilities of a reversal.
A bullish divergence is signaled when prices move lower but a technical indicator that is an oscillator moves higher. This is a valid technical signal to go long based on technical analysis. Of course it is just a high probability, it doesn’t always work so proper position sizing is still required and stop losses must be used. Also the profitability is not in the entry it is in the exit so it is crucial to have a strategy in place for how you will both maximize and eventually lock in profits when it does work out as a big win.

Image courtesy of TrendSpider.com