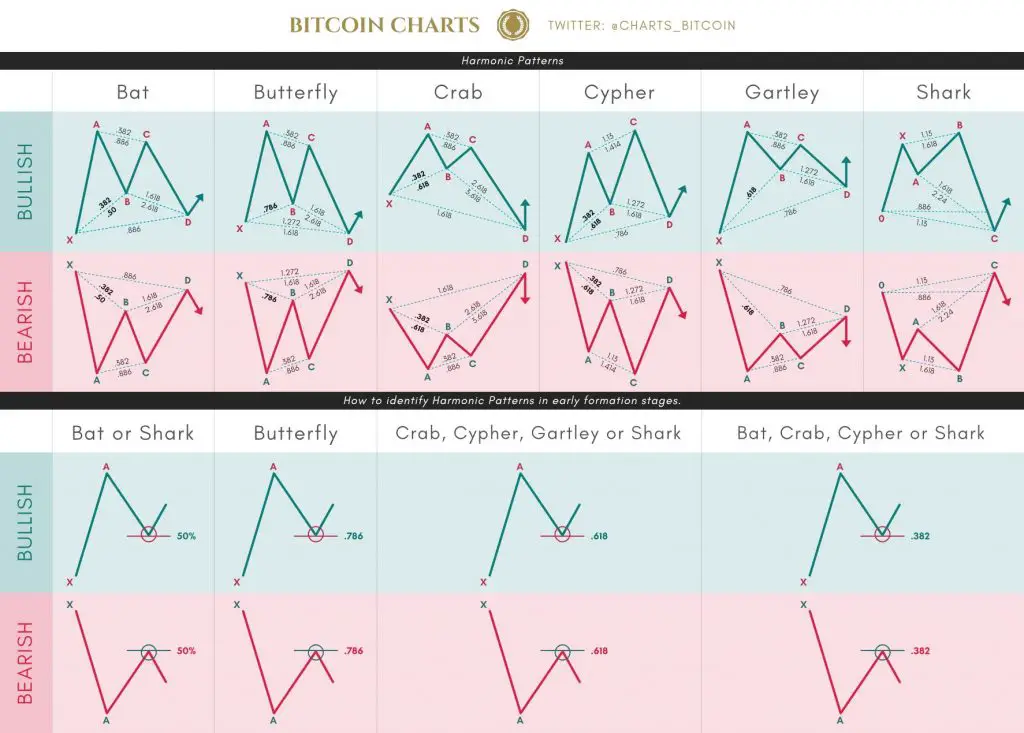
Harmonic Patterns use the identification of quantified chart price action structures that have specific and consecutive Fibonacci ratio alignments that form the visual structures. Harmonic patterns calculate the Fibonacci levels of the price patterns to identify high probability reversal points on the charts. This method believes that harmonic patterns or cycles repeat on charts in cycles repeatedly. The key to using this strategy is to identify these patterns and to use them for creating good risk/reward ratio entries and to exit when a profit target is reached. Positions are taken based upon the odds that the same historic patterns will repeat after entry.
Here are the most common harmonic chart patterns:
Traders use the Potential Reversal Zone (PRZ) as the key level for support/resistance in their price action trading strategy.
Harmonic Patterns
I’ve created a cheat sheet for you that will help with identifying harmonic patterns.
Feel free to RT or share this with your friends so we can help more people out! #cryptotrading #daytrading #HarmonicPatterns #Bitcoin #altcoins #cryptourrency #crypto pic.twitter.com/MfpZDLOcv0
— Bitcoin Charts (@charts_bitcoin) November 12, 2021
