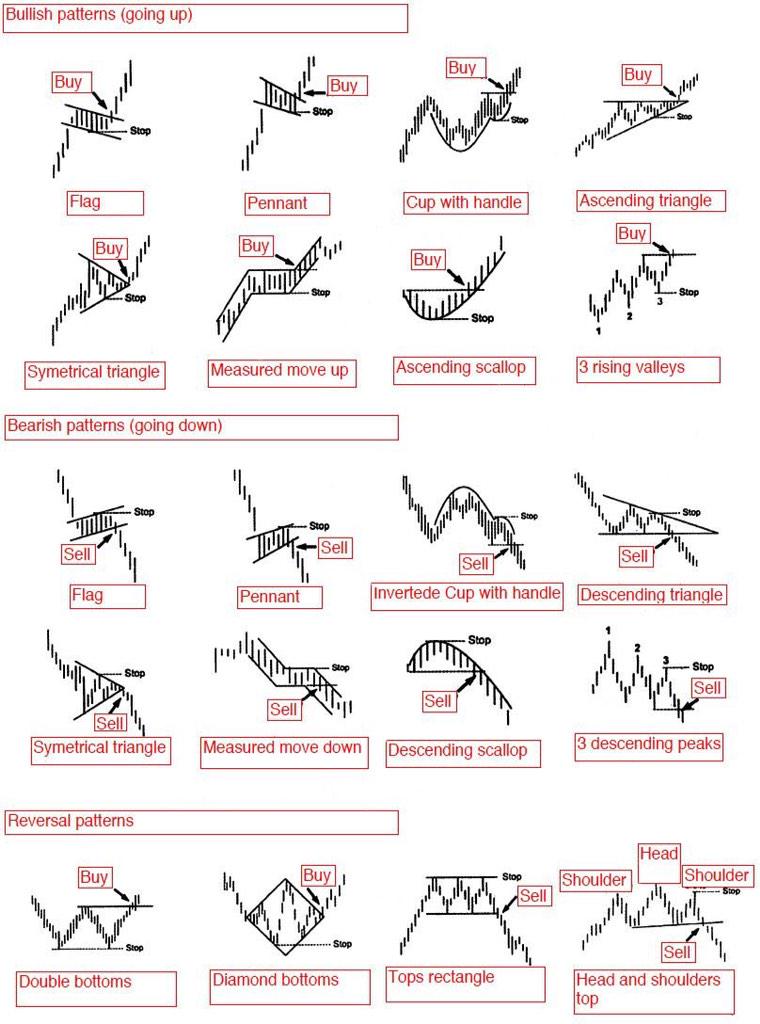
Here is a visual index of all the most popular chart patterns used by traders to visually trade price action in the path of least resistance. The most misunderstood concept of using chart patterns to trade is that the edge doesn’t come from their ability to predict the future or their win rate. The edge is in the reactive ability of a trader to quantify a good risk/reward ratio at entry and capture a trend for a big win as they occur. The trend line break is a trend following signal that puts the trader on the right side of a price move. Chart patterns can be bullish, bearish, or reversals to show the probability of the next direction for price action. Chart patterns can apply to all markets and all time frames.

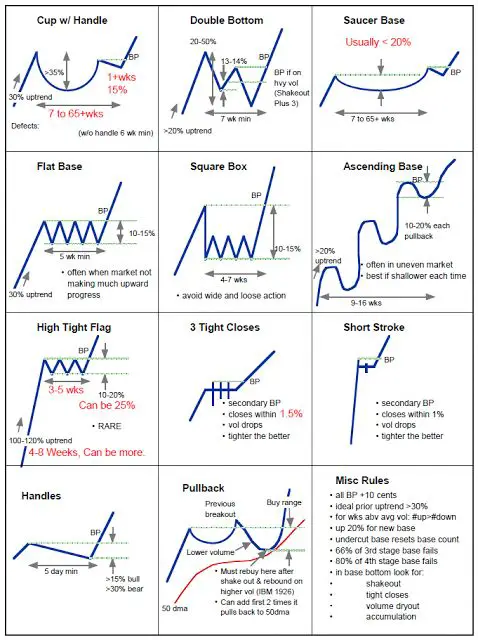
Chart patterns can also be looked at as longer term accumulation and distribution patterns in markets. Below is a more quantified way to look at stock chart patterns in terms of percentage moves and time to build a price base and breakout.

For a deep dive into each chart pattern you can check out my book The Ultimate Guide to Chart Patterns.