An inside candle pattern shows price is trading within the previous range of a time period. This candlestick pattern can show a trader that a chart is currently trading in a range and not breaking out and trying to swing or trend in one direction. This is a range bound indicator.
An inside candle on a chart shows that the high price for the current time period is lower than the high of the previous period and also that the low price for the current period is higher than the low of the previous period.
The price action for the current inside candle shows that all movement takes place inside the previous candle. This price action candle pattern shows a range and consolidation of movement. The inside candle shows that sellers and buyers at this price range are balanced to a level where buyers can’t mover the price higher over previous resistance and sellers can’t take it lower below the previous support. This shows new current price agreement inside a smaller area than the previous range of movement, a future break through one side of the previous candle will show what side wins. An outside candle starts when a future candle eventually breaks out above previous candle resistance or breaks down below previous candle support. An inside candle also shows a compression of volatility.
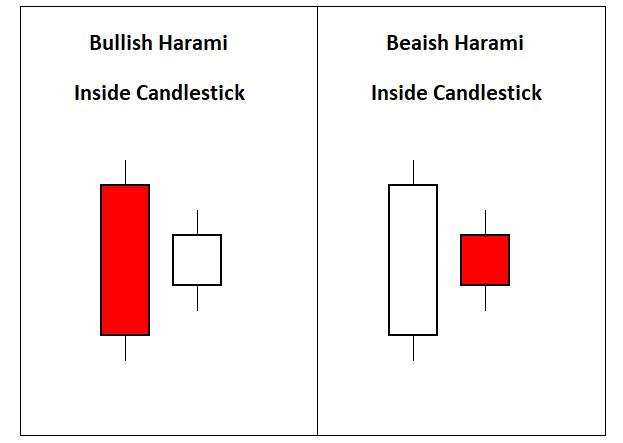
Inside candlestick patterns are called a harami:

A bullish harami is a minimum two candle chart pattern that can signal a downtrend in a chart could be beginning to reverse. A bullish harami is commonly formed by a small bullish candle that has a price range inside the previous bearish candle. This pattern can appear to form during a price range but it has the most meaning when it occurs during a downtrend on a chart.
The word harami comes from a Japanese word meaning to be pregnant. This candle pattern shows metaphorically that a large bearish mother candle is pregnant with a smaller bullish baby candle.
Many times the second bullish candle can be a doji and this indicates that sellers were not able to take prices any lower. It shows bullish sentiment set in as it closed higher than the open. Also, volatility contracted and the smaller trading range shows more agreement by traders at these prices and not accepting lower prices. The bullish harami can mark the end of a downtrend as no newer low in price was set and it shows a high probability signal for a reversal back to higher prices.
A bullish harami candlestick pattern has better odds of being valid if it occurs on a chart in an oversold area like a 30 RSI or a lower 2nd or 3rd deviation from the 20 day moving average. This pattern is a reversal signal in a downtrend giving a potential dip buy signal. During an uptrend a bullish inside candle can be continuation pattern.
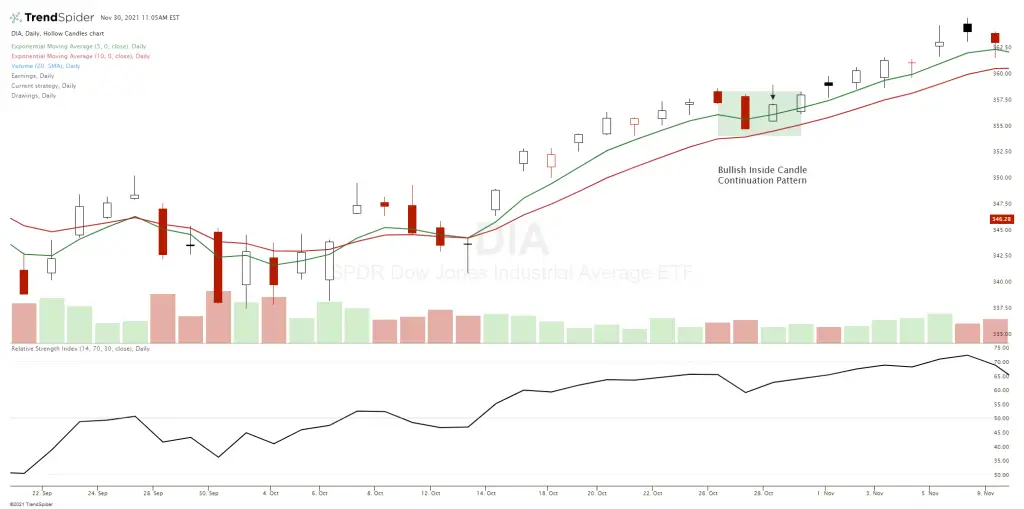
In the below example a bullish harami forms during a small pull back in the uptrend and acts as a bullish continuation pattern back higher. The following candle after the inside candle confirms the break higher over previous resistance on this chart.

A bearish harami candlestick pattern is created by two candles, first a large bullish candle then next a small bearish candle. The full trading range of the opening and closing prices of the second smaller bearish candle must be completely engulfed inside the body of the first large bullish candle. This formation signals the probability that a reversal is about to occur during an uptrend as this pattern is bearish showing a rejection of higher prices.
The size and range of the second bearish candle can be an indicator on the likelihood of a reversal. The smaller the bearish candle the higher probability of a reversal happening as it shows buyers are absent at higher prices and that price has lost momentum and stopped ascending higher.
The bearish harami can be a signal to lock in profits for long positions during uptrends as it shows the uptrend may have ended with the rejection of higher prices during the second period. The second bearish candle confirms that the high on the chart may be in for now. A short position trade can be taken at the end of the second bearish candle signal if the chart is over bought and extended from the mean with a stop loss on a move above that bearish candle.
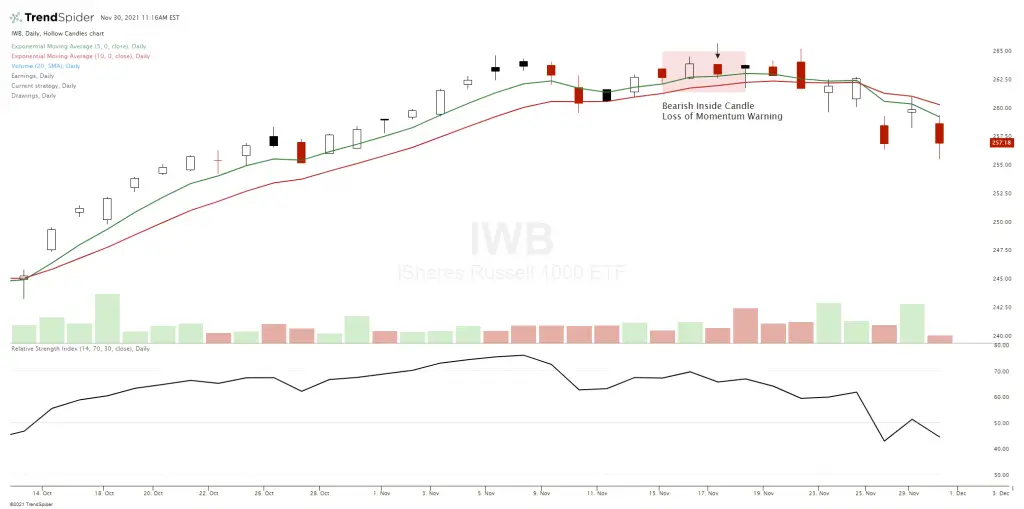
This is a bearish reversal candlestick pattern in an existing uptrend. The probabilities of this signal working out are increased if it occurs near the overbought 70 RSI on a chart or at three or more standard deviations from the 20 day moving average. This pattern has additional confirmation if the next candle after these first two is a bearish candle. During a downtrend a bearish inside candle can be continuation pattern signal as a rally fails to continue higher and the downtrend resumes.

Inside candles show both a loss of momentum from the previous period and increase the odds of a reversal of the current directional trend or swing in price or at the least a new price range before the next move higher.