What does a black candlestick mean on a chart?
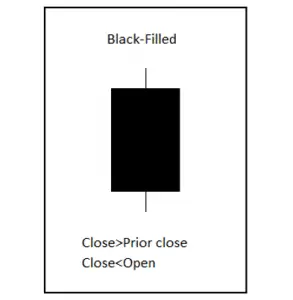
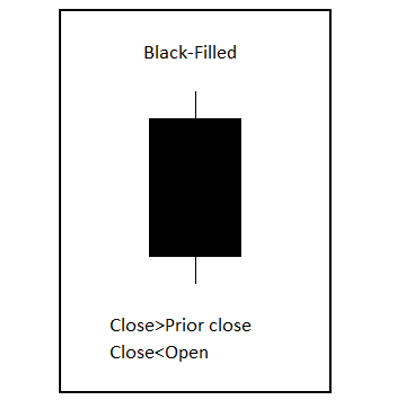
A black candlestick forms on a chart set for hollow candles where all candlesticks will be set for filled or hollow and will appear as white, red, or black. The black candle forms when price closes lower than it opens but the closing price is still higher than the previous close.

The black candle can be a reversal or continuation signal depending on where it appears on a chart pattern.
During an uptrend a black candle forming can signal the end of the trend and that the probabilities have shifted to a downswing in price or at least that the chart will begin going sideways, this can be a reversal signal. During a downtrend in price the black candle shows a failure of price to hold higher levels as it closes off the highs of the period which can show a continuation pattern.
A black candle is a bearish candle where ever it appears on a chart and shows that the buyer’s attempt to keep prices higher failed on that attempt even though it closed above the previous candle’s highs.
A trader doesn’t want to see a black candle form while they are long on a chart as it shows a failure of momentum to go higher.
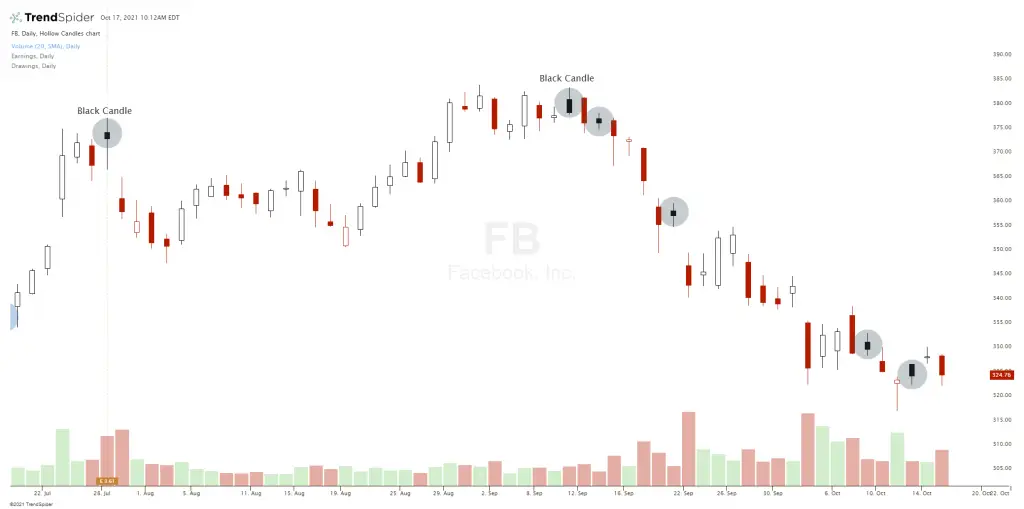
Below is an example of six black candles that formed on the Facebook chart, two were short term tops and the other four were all bearish for this chart.

