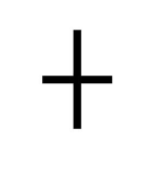
The star doji is a neutral signal candle signal that has opening and closing prices that are the same price level or very close. A single star doji candle shows that buyers and sellers reached equilibrium during the candle period as the close and open were the same price level. When a star doji appears inside an existing trading range it reinforces that a chart is going sideways in price. In Japanese, “doji” means a mistake, implying that this candle is rare as both the buyers and sellers were mistaken about price as it moved both above and below the open only to return to where it started. The doji pattern must be considered inside the context of the total chart. A doji pattern near an overbought level on a chart can be considered bearish while a doji pattern near an oversold area could be considered bullish as it can show a potential confluence of reversal signals.

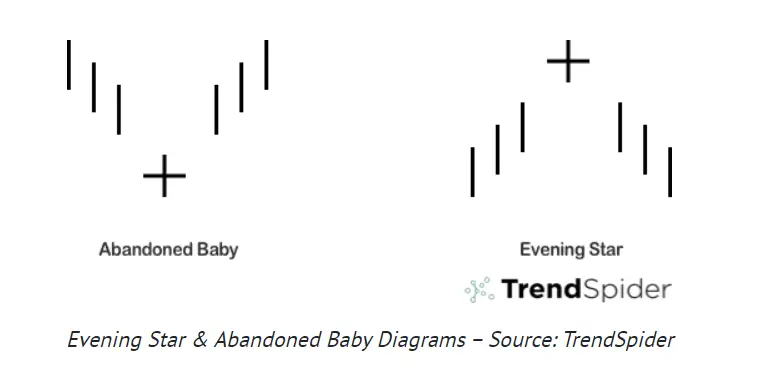
Star dojis are neutral patterns as individual candles but can be part of more complex patterns as surrounding candles give them meaning inside the context of a price move. Technical analysis does consider the star doji a reversal signal if it occurs during a trend between candles that are either both above or below the star doji. They are neutral when they occur inside trading ranges, they can be bearish as they occur at the end of an uptrend as price starts going lower, and they can be bullish at the end of a downtrend if price then reverses and begins to go higher.

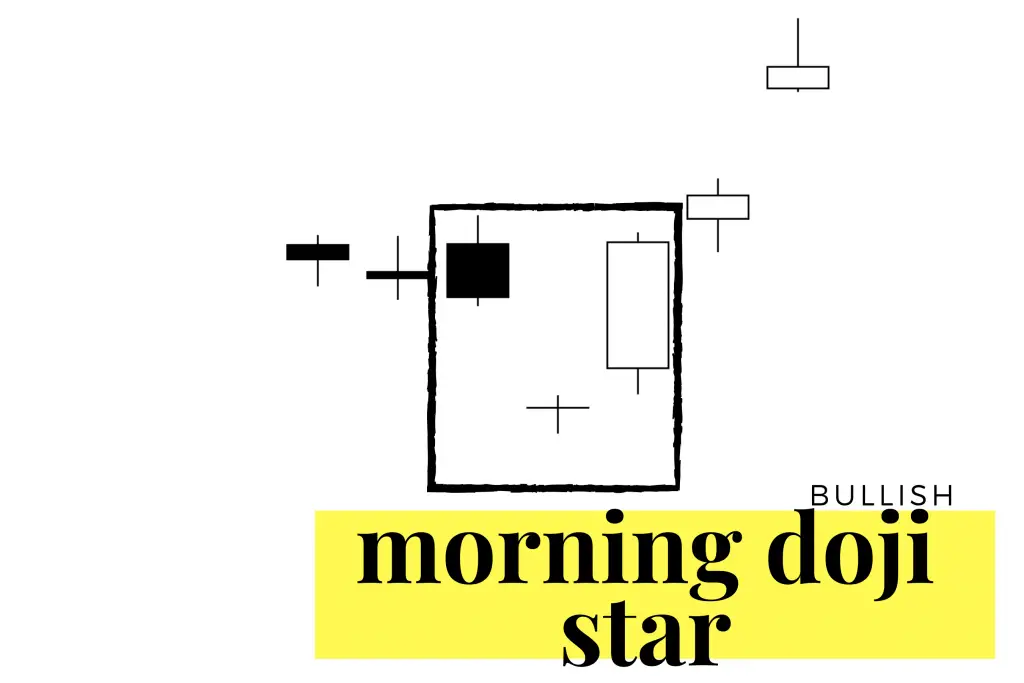
Bullish Morning Star Doji:

Image by Colibri Trader @PriceInAction
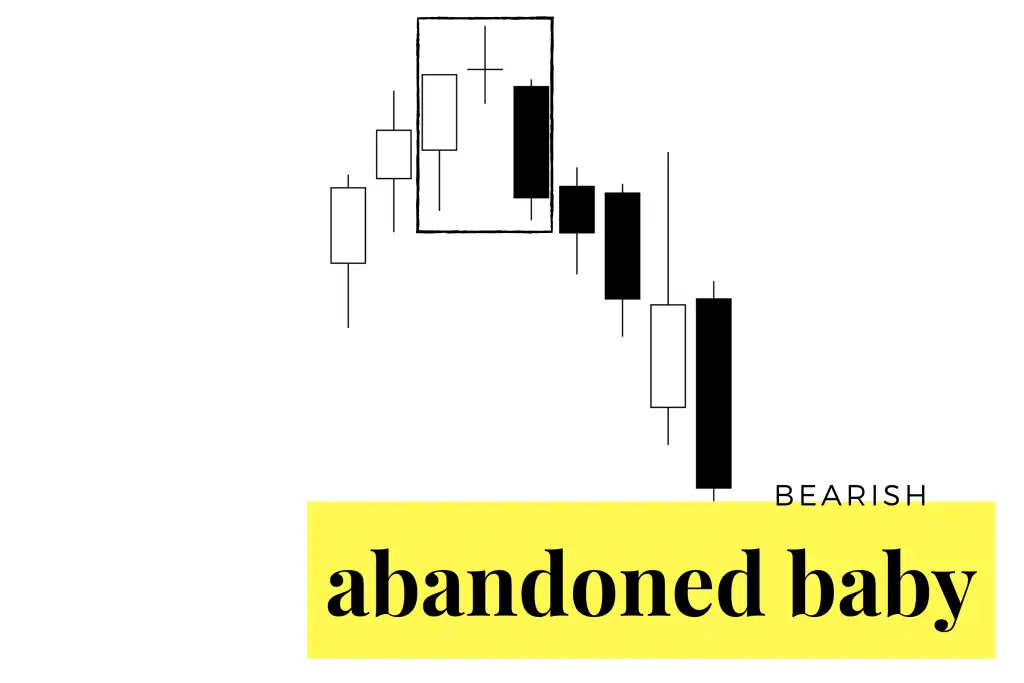
Bearish Evening Doji Star:

Image by Colibri Trader @PriceInAction