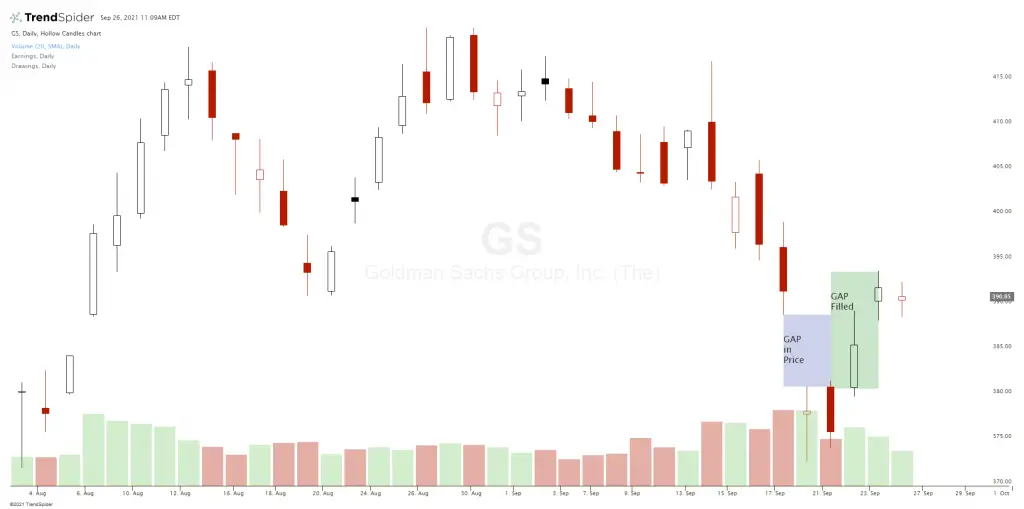
A gap in price on a chart shows that there were no buyers and sellers connecting at price levels from a closing level to the next opening level. Gaps happen when sudden news comes out that changes prices to higher or lower degree than expected. New information can be priced in by buyers and sellers causing a void in the confluency of prices on a chart leaving an unfilled space.
Common market sayings are that “Gaps always get filled”, “Charts hate gaps” and “Mind the gap.” Gaps should be watched closely because they can signal a new direction for a chart, if they retrace and fill the gap then that can signal a quick reversal back to the original trend on the chart. Eventually most gaps do get filled if the chart does not begin a sustained trend in the direction of the gap. A gap on a chart that doesn’t fill usually tends to continue in the direction of the gap for at least the rest of the day.
What is a gap fill in stocks? A fill the gap stock is one that has the price action move back through the open space previously made on the chart. For a gap down to be filled price must rally back to the previous candlestick low. For a gap up to be filled price must fall back down to the previous high of the last closing candlestick. Sometimes after a gap fill takes place the original gap direction can continue if the price doesn’t break through the gap fill area and continue moving in that direction. In that case the gap fill was just a retracement before a continuation of the gap move.
A gap on a chart is considered to be filled when the price action moves back completely through the open gap area where trades were missing. Once price has returned to where it was before the gap it is technically filled. If price moves inside the gap area but does not move all the way through it to the previous candle, it is called a partial gap fill.
Gaps can be strong signals of momentum, trend continuation, or a reversal signal depending on the context of the chart.
- A gap up out of a price base to all time highs can be a trend trading signal to the upside.
- A gap down out of a price base to new all time lows can be a trend signal to the downside.
- During a trend in price a gap in the direction of the current move can signal a continuation of the trend.
- During a trend in price a gap against the direction of the current move can signal the trend is weakening or reversing.
The path of least resistance begins in the direction of the gap in price action but a gap fill is an even stronger momentum rejection and reversal signal in the opposite direction. There are few technical signals stronger than a gap in price. The bigger the gap the stronger the signal whether it continues or reverses. A fill the gap stock is one giving a strong reversal signal that the gap failed.
The below gap down in the Goldman Sachs chart is filled intraday two days later followed by a breakout above the filled area the day after the fill.

Chart courtesy of TrendSpider.com