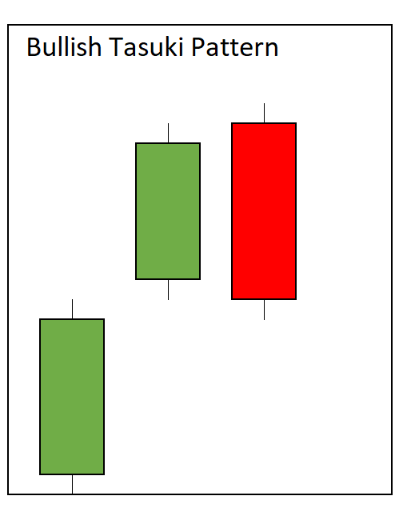
The Bullish Tasuki Gap candlestick pattern is a three-candle continuation pattern during an upswing in price that signals the uptrend will continue.
- The first candle in the pattern is a large bullish white or green candle making a higher high and higher low than the previous candle.
- The second candle is also bullish and white or green with an open gap above the close of the previous candle.
- The third candle is bearish and black or red that moves partially inside the gap between the previous two bullish candles but doesn’t completely fill the gap.
The Bullish Tasuki Gap shows the strength of an uptrend with the gap in price of the second candle in the pattern, and its higher prices. The third candle in the pattern is a slight reversal but if the full gap can’t be filled the pattern stays valid and bullish. The original gap before the pattern begins shows a lack of sellers at those price levels and is very bullish.

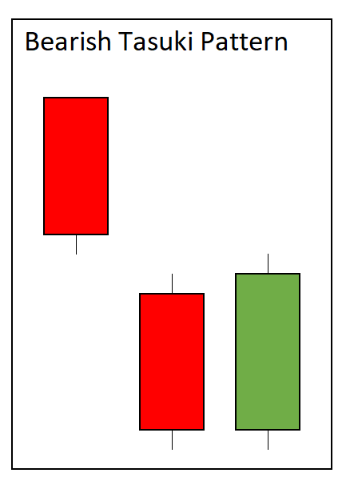
The Bearish Tasuki Gap candlestick pattern is a three-candle continuation pattern during a downswing in price that signals the downtrend will continue.
- The first candle in the pattern is a large bearish black or red candle making a lower high and lower low than the previous candle.
- The second candle is also bearish and black or red with an open gap below the close of the previous candle.
- The third candle is bullish and white or green that moves partially inside the gap between the previous two bearish candles but doesn’t completely fill the gap.
The Bearish Tasuki Gap shows the strength of a downtrend with the gap in price of the second candle in the pattern, and its lower prices. The third candle in the pattern is a slight reversal but if the full gap can’t be filled the pattern stays valid and bearish. The original gap before the pattern begins shows a lack of buyers at those price levels and is very bearish.
