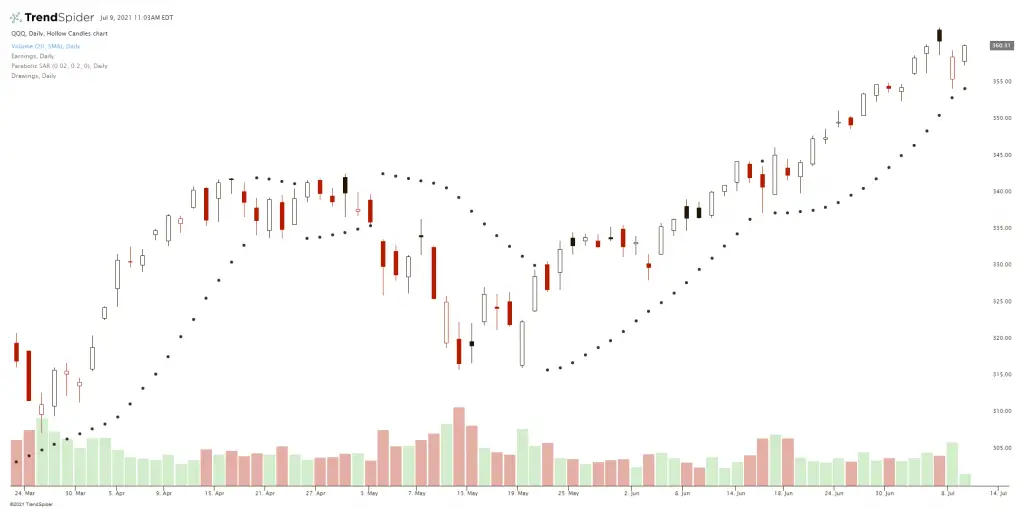
The Parabolic SAR (stop and reverse) indicator is a technical trading tool that quantifies both trends and price reversals on a chart and can be used as a stop loss, trailing stop, or entry signal. The Parabolic SAR indicator was created as a trend following tool that allowed winning trades to run until they stopped and reversed maximizing the gain in trend.
This technical indicator creates a parabola on a chart using small dots above or below the price action. If below the price it is bullish showing an uptrend and shows the support area where it would signal a trend reversal. When price falls beneath the dots on the indicator it signals a stop loss for a new trade or a trailing stop for a winning trade. A trader should be thinking long when price is above the dots and short or in cash when price is below the dots.
The parabola dots show the overall trend on a chart based in its curve and relation to the price action above or below it. It can act as resistance for price above or support for price below. It is both a momentum and trend indicator as it can visually show an uptrend when curving up, a downtrend when curving down, and a trading range when going sideways. Traders can see a price break above the upper parabola as a momentum buy signal or a buy to cover short signal. The Parabolic SAR can be used in the context of other indicators like the RSI along with candlestick patterns to get a complete view of the chart and if the PSAR signals present a good risk/reward ratio when they trigger.
