The parabolic definition in terms of trading and investing refers to a parabolic move in price on a chart and comes from the mathematical term parabola.
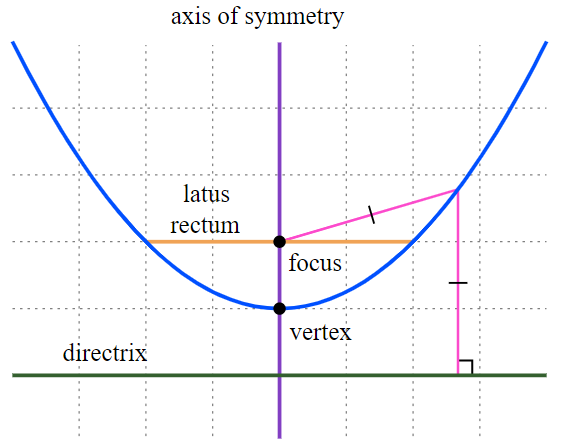
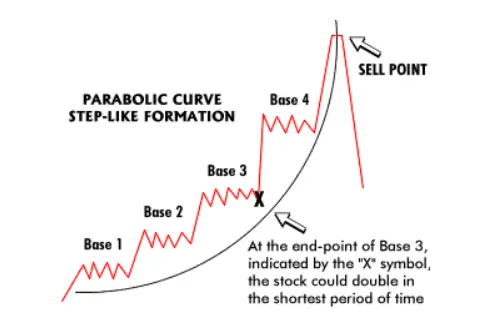
Below is what a parabola looks like and what describes a parabolic move on a price chart when you see it happening.

Melikamp, CC BY-SA 3.0 <https://creativecommons.org/licenses/by-sa/3.0>, via Wikimedia Commons
During a parabolic move, price goes up in a steep upward incline on a chart as buying increases dramatically bidding up a price higher and higher with little if any short term pullbacks. Price action moves nearly straight up and looks like a parabola pattern.

A parabolic move on a chart is one of the most powerful types of chart patterns showing extreme fear of missing out and chasing price higher and higher until it depletes all possible buyers. A parabolic move many times can go into extremely overbought readings over the 70 RSI and be over 4 to 5 deviations from the 20-day moving average.