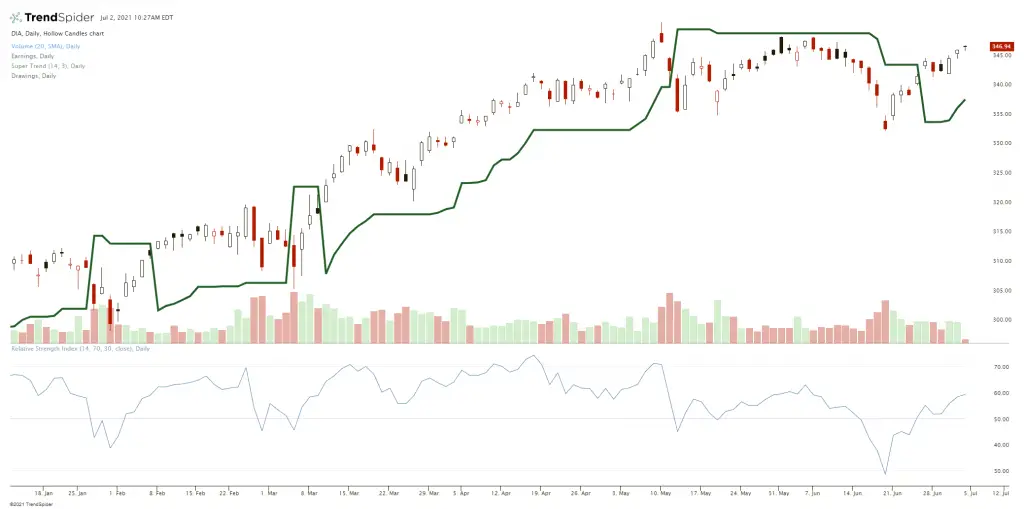
The Supertrend is a trend trading indicator used to define the path of least resistance on a chart. The SuperTrend is a technical indicator that signals the direction of current momentum. It uses the Average True Range to calculate its value. It generates buy and sell signals as price moves through the current indicator value, a crossover signals an upswing and a cross under signals a downswing. During trading ranges in price action the line can act as a support or resistance area on a chart.
This indicator is quantified and built using two parameters, a time period and a multiplier. The popular default values used are 14 for the average true range time period and three as its multiplier.
The Supertrend uses the ATR to calculate its value as it signals the degree of price volatility. It is similar to a 3-ATR trailing stop but is used in this context to look at the trend on the chart instead of just the volatility. The principles are the same for this indicator as they are for using the 3-ATR line in trade management.
If price is above the SuperTrend and the line is vertically going up it is signaling ascending higher prices and price below this line with the Supertrend vertically going lower is signaling descending lower prices. If the SuperTrend line is flat it is signaling price going sideways and could act as resistance when above or support when below the price range.
The line itself is the signal but can be combined with other technical indicators to signal more precise entries and exits like an overbought and oversold RSI. The RSI could show the risk/reward ratio in a trend as uptrends tend to slow near the 70 RSI and downtrends tend to end near the 30 RSI. The SuperTrend is a great trend trading indicator to have in your toolbox.
