Market Profile is an intraday technical analysis process that records price on the vertical axis and time activity on the horizontal axis of a chart. This strategy was developed by J. Peter Steidlmayer when he was trying to determine and evaluate market value as it developed on the daily chart. The chart displays price on a vertical axis along with time on the horizontal axis, and creates a graphic that usually resembles a bell curve as it is wider at the middle prices, with less activity and diminished volume at the extremes of higher and lower prices. Inside this structure he recognized the normal areas of action through the Gaussian distribution he learned in college statistics.
The basic auction building block recorded by the Profile is the time-price opportunity.
The three components of the TPO are:
- Price shows opportunity when there’s a clear distinction between price and value.
- Time regulates all potential opportunities.
- Volume measures the success or failure of these potential opportunities.
The Market Profile offers a charting approach that is much different visually from bar or candlestick charts, which are more popular to use as charts historically.
#ES_F Structure and vwap working together like chocolate and peanut butter🤣🤣🤣 pic.twitter.com/7JNKFmRsDo
— vwaptrader1 (@vwaptrader1) March 16, 2021
There is a big visual difference in the candlestick chart on the left in contrast to the composite Market Profile chart on the right in the above tweet example. The Profile chart’s construction creates a display that shows market structure. It quantifies more price, time, and volume information than traditional charting with candlesticks and bar charts. Market Profile tries to reveal the underlying behavior of traders and show the true sentiment of the market environment. The Market Profile chart attempts to show where the most trades occured, at specific price levels, how many trades, and over what period of time. The Profile shows more dynamics and levels of information that can give clues and signals about what emotions or beliefs are driving price action.
The chart generated by the Market Profile process shows quantified market-generated information. A trader sees the real buy and sell orders used to trade on the exchange. It helps to figure out the traders in which time frames are showing up, observe supply and demand, see trade executions, fearful or greedy trading, and other clues that are not clear in normal charting and technical indicators.
Market Profile brings together several valuable data points on one chart so they can be seen together in context with one another. It tries to bring together price, volume, and time into one composite to see the full market sentiment. It show the flow of price action more clearly when these other factors are taken into consideration. It takes time and study to learn how to read, interpret, filter and trade off the signals that a Market Profile chart shows based off order flow. Many long term experienced traders only use this charting method in their trading. Its value is based on how you use it to create great risk/reward ratios.
If you wish to learn market profile better follow two things to start with a) start looking at tpo charts with letters readable not compressed.Compressed charts kills entire purpose.Profile reading makes the learning better b) Start learning jargon and definition then use them. pic.twitter.com/figqkkQcKY
— RK (@assortZ) June 19, 2021
Bell market profile pro chart: BANKNIFTYJUNFUTURES #marketprofile at 11:30 AM#banknifty #nifty #nseupdates #StockMarket pic.twitter.com/w0fe7MXC4Z
— belltpo (@belltpotw) June 25, 2021
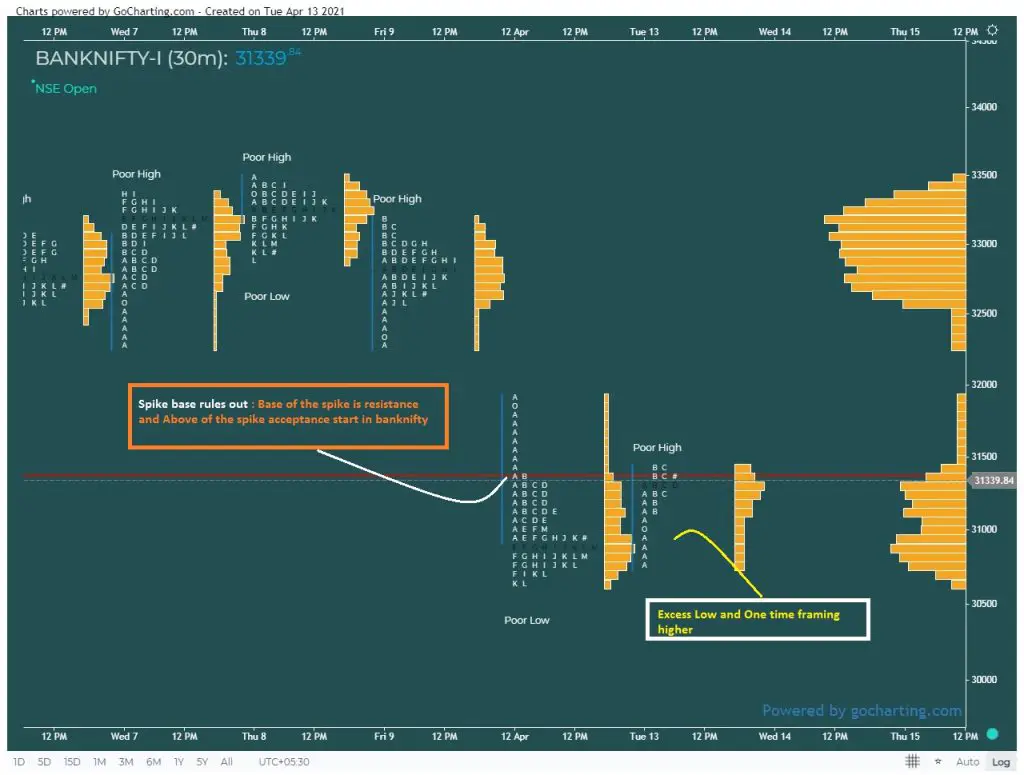
Bank-nifty market profile chart. #banknifty @gocharting pic.twitter.com/NYXyA8DGrb
— Piyush 🇮🇳 (@Niftyanalyser) April 13, 2021
