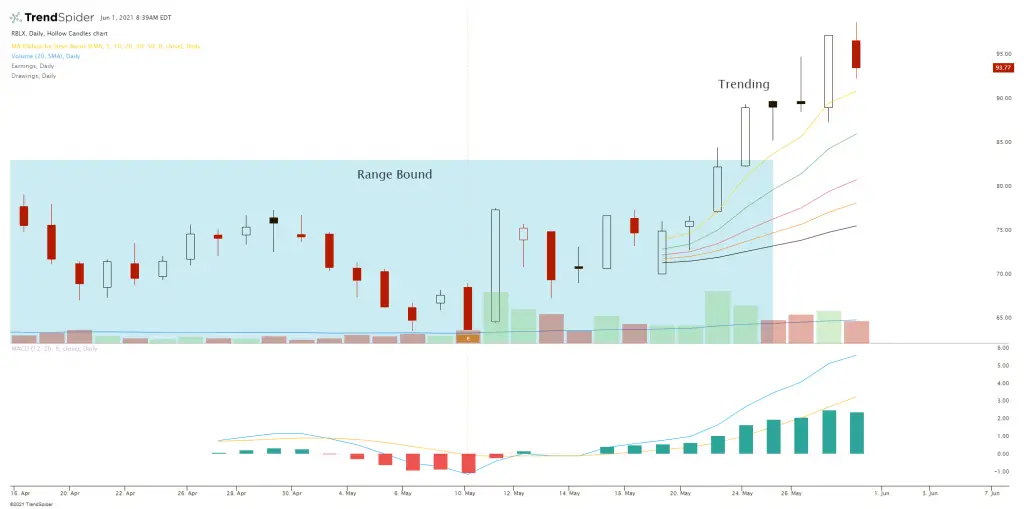
Trending stocks are ones that are moving strongly in one direction whether up or down.
Here are trending stock checklists:
Stocks in an uptrend:
- Making higher highs and higher lows.
- Price is above key moving averages.
- The chart has moving average crossover signals.
- Price is near all time highs.
- Price is near 52-week highs.
- Volume is increasing with price.
- Technical indicators are bullish.
- Technical indicators are showing momentum to the upside.
- Sentiment is bullish for the chart.
- A breakout of a trading range to the upside.
- High percentage gain in price on the chart.
- High revenue and sales are projected for the company.
Stocks in a downtrend:
- Making lower highs and lower lows.
- Price is below key moving averages.
- The chart has moving average crossunder signals.
- Price is near all time lows.
- Price is near 52-week lows.
- Volume is increasing as price goes lower.
- Technical indicators are bearish.
- Technical indicators are showing momentum to the downside.
- Sentiment is bearish for the chart.
- A breakout of a trading range to the downside.
- High percentage loss in price on the chart.
- Low revenue and sales are projected for the company.
These parameters are time frame dependent for the trader or investor. A buy and hold investor will quantify a downtrend differently than a day trader. The more that a chart meets the above metrics the greater the strength of a trend is likely to be.
“The answer to the question, What’s the trend? is the question What’s your timeframe?” – Richard Weissman
