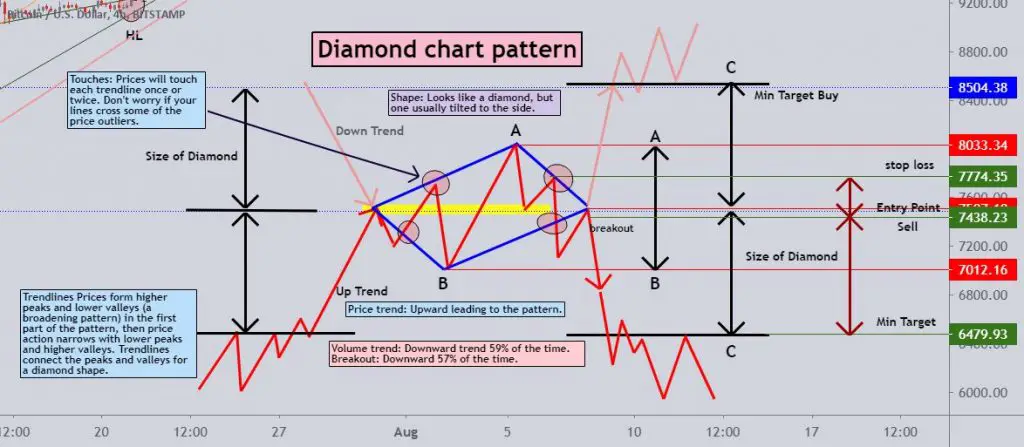
The diamond pattern is a price action formation that is created on a chart by buyers and sellers. It is a lesser known chart pattern to technical traders than many of the more popular patterns.
The diamond chart pattern is a reversal pattern on a chart that occurs less often than pennants and flags and is rare. It can occur near the highs of a chart creating a diamond top pattern or near the lows on the chart creating a diamond bottom pattern. The diamond top can be bearish and the diamond bottom can be bullish. Both look familiar in their pattern and signal the potential end of the current trend but it is the location they appear on the chart which determines their signal for sentiment.
A diamond chart pattern starts by first forming a broadening formation with ascending resistance and declining support that is followed by a triangle pattern that has descending resistance and ascending support. It is the breakout of the second half of the diamond pattern that signals the entry whether it is a bullish break over resistance or bearish break under support.
A clear uptrend must be in place before a valid bearish diamond top pattern reversal signal. A clear downtrend must be in place before a valid bullish diamond bottom pattern reversal signal.
Diamond Reversal Chart Pattern https://t.co/uvYPdXzcSV 🙋 Bet with $BTC via ⟶ https://t.co/H9SQoWZI9l √ pic.twitter.com/dOwduxTDhs
— Trade Alerts, Trade Ideas and Crypto 🇺🇸 (@AlertTrade) August 9, 2020
Kotakbank : Daily Chart
1. Diamond pattern
2. Volume interested@TraderHarneet pic.twitter.com/yBqUYXwbYU— Sujit (@Sujit26014714) May 27, 2021
