The ABCD chart pattern also known as the AB=CD, is a popular harmonic pattern in classic technical analysis. The ABCD pattern is suppose to identify a harmony in correlation between both the price and time on a chart. This pattern is referred to a measured move as its movements can be of the same magnitude through different legs of the swing . It was created originally by H.M Gartley, and is considered one of the Gartley patterns.
There can be 3 different kinds of moves on a chart considered to be an ABCD pattern.
- With a price and time type of ABCD pattern the distance and the time it takes for price to travel from A to B is the same as the time and distance from C to D.
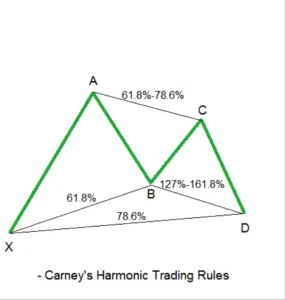
- In the most popular and classic version of the ABCD pattern, the BC is a Fibonacci retracement of between 61.8% – 78.6% of AB, with CD being the extension leg of between 127.2% to 161.8% and nearly equal in the price move of AB.
- In an ABCD extension the CD leg of the move is an extension of AB that is between 127.2% – 161.8%

How can the ABCD pattern be traded?
- Swing points A and B form the highest high and the lowest low of the first swing in price action.
- When AB is identified on a chart, then the potential BC swing can be measured.
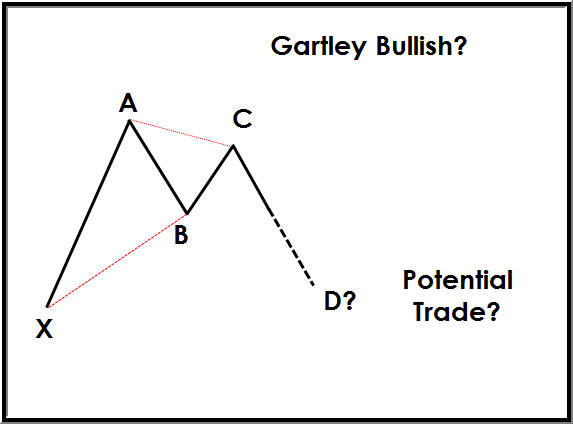
- C must be at a lower price than A and must be the high in price following the low point at B. This will make a short term double top pattern.
- C usually retraces to between 61.8% to 78.6% of the AB move.
- During strong chart trends, C could move up to 38.2% or 50% of the AB swing.
- Point D on the chart must be a new lower price below the previous price point at B to signal the pattern confirmation.
- CD must be between 127.2% to 161.8% of AB or of BC to finish the pattern.
- Buying at point D as it reaches the full retracement is a possible dip buy signal to catch a swing back higher.
-

Chart courtesy of StockCharts.com